What Does 15 Years Of Wildlife Trade Data Tell Us?


Bahasa Indonesia | Tagalog | ไทย
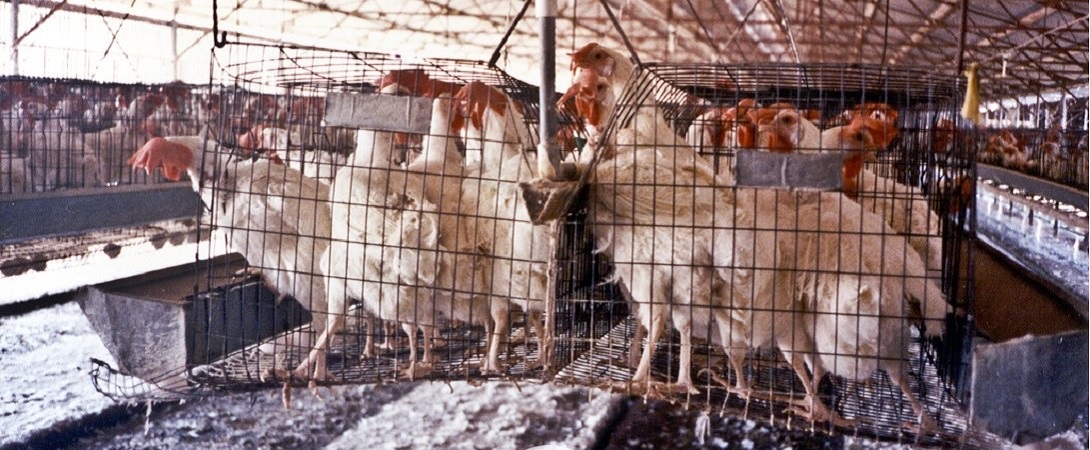
The global trade in wildlife is a huge problem — and it’s an issue that even has its own category in the Faunalytics Research Library. The problem doesn’t just lie in the obvious welfare issues inherent with keeping exotic companion animals, for example. The wildlife trade for pets and parts has tremendously negative direct impacts for the animals involved, and even further indirect impacts as it strains biodiversity, endangers species, and contributes to myriad other ecological issues.
There are two key dimensions of the wildlife trade: there is the illegal trade, where clandestine groups and individuals kill or capture wildlife for use and abuse on the black market; then, there is the legal wildlife trade, where certain species are sold as pets or used for their parts, in a way that fits within the parameters of the law. It’s important to say here that these two dimensions have a lot of overlap between them: what’s legal in one country may not be in another, and a lot of the illegal wildlife trade includes “laundering” activities that help certain species and products appear to have legal origins. The overlaps between the two types of trade make analyzing the overall industry a murky endeavor, to say the least.
The aim of this analysis was to examine United States wildlife and wildlife product imports, with a focus specifically on the scope and breadth of the legal trade. While the illegal trade is important and rightfully gets a lot of attention, we can only get a picture of it through the data of what enforcement agencies are able to catch — the rest is extrapolation and estimates. To conduct our analysis, we reviewed 15 years (2000-2014) of data from the Law Enforcement Management Information System (LEMIS), originally collected by the United States Fish and Wildlife Service (USFWS), cleaned, standardized, and stored in an R package called lemis by EcoHealth Alliance. You can find more information about this dataset here.
A World Of Suffering: Trends & Totals, 2000-2014
The first thing that emerges from a quick glance at the statistics is just how broad the legal trade in wildlife is: across 15 years of data, the legal trade involved over 2 million separate shipments, comprised of more than 60 biological classes and more than 3.2 billion live organisms. While such numbers might pale in comparison to the number of animals killed for food every year, it clearly represents a threat to ecosystems, and the individual species that inhabit them.
In the graph set below, you can see some details on the number of unique shipments per year, annual dollar values, the number of items per year, and the overall weight of shipments per year.
In the next graph below, we can see some further granular detail — namely, the import value by shipment year and taxa. This graph really starts to tease apart what kinds of animals are the most “valuable” on any given year, across time, and shows spikes dips at various times.
It’s worth noting here that the vast majority of species in this dataset are not currently reported on by Convention on International Trade in Endangered Species, or CITES, an international agreement whose aim is “to ensure that international trade in specimens of wild animals and plants does not threaten their survival.” While that is a broad-sounding mandate, in practice CITES manages what they do based on species vulnerability — species are ranked similarly to the IUCN Red List, and those who are most precarious get more attention.
Below, this graph shows how many of the wildlife trade shipments from 2000-2015 were refused or otherwise identified as illegal. While the actual number of refused shipments can fluctuate by several thousand from year to year, refusals have stayed proportionally steady at about 2% of total shipments, or below. These historically low percentages reveal a key problem: regardless of the measures that are taken to root out the illegal wildlife trade, so much of the trade is legal, and simply outside of the enforcement capabilities of any government or group of governments.
Finally, let’s look at the most common countries of origin and ports of entry, with a focus on the top 10. While many of the countries of origin may not be surprising given what we know about the global wildlife trade, other countries like Canada are more surprising. Overall, from 2000-2014, shipments into the U.S. came from 252 different countries of origin, with 75% of all shipments coming from the top 15 countries. In the graph set below, we look at the top 10 countries of origin in terms of the total number of items, and the top ports of entry into the United States by the percentage of total shipments. We can see immediately that China and the Philippines far outpace all other countries of origin, while four ports of entry — Los Angeles, New York City, Miami, and Newark — account for about 50% of all shipments.
Digging Deeper
Going past the broad strokes painted above, interesting details emerge if we look more closely. In the graph set below, we look first at the most common types of items that are traded, revealing that shell products and live specimens dominate all others. In the second tab, we look at the most commonly traded items by weight, which reveals that meat and dead animals lead by far, while the “unspecified” category leaves unanswered questions.
Indeed, looking more closely reveals that the wildlife trade is a weird world, with the types of items, and their values, raising some eyebrows. In the graph set below, we can see the overall value of imports for different categories of items by description, and the average import price per unit of different items. At a glance, we can see that ivory is still an item that gets shipped and traded — even though much of the international trade and commercial sale has been banned since 1990. Why? In the U.S., regulations allow ivory to be legally imported into the country as hunting trophies, and also allow “pre-ban” ivory to be traded across state lines. Meanwhile, much more exotic items like calipee — a gelatinous substance from the lower shell of turtles — fetches nearly $1,700 per unit.
When we think about all of this, it begins to beg the questions: why is all this trade happening, and what is the nature of the supply chain? Though the data doesn’t perfectly capture this, the declared reasons why animals and parts are being imported are telling. In the graph set below, we can see the most popular stated reasons why animals and parts are being imported, and on the flipside, the stated sources from exporting countries. Though there are some interesting nuances here, the majority of items are being imported for commercial purposes (or as hunting trophies), and the vast majority of them are being taken from the wild, or bred in captivity.
The overall picture painted is disheartening: the legal wildlife trade seems operate in earnest, out in the open, and legal interventions are minimal. While digging into the details helps us to reveal some of the nuances and particularities of the trade, it’s important as animal advocates to think beyond this dataset, the legal trade it represents, and how we can decrease the trade and its impact in the future.
2015 & Beyond: Spikes In Seizures And The Role Of Corruption
Of course, the wildlife trade didn’t end in 2014, and it has continued in earnest in the last several years. The United Nations Office On Drugs And Crime (UNODC) released a report in 2020 looking specifically at the traffic in protected species. This is different than much of the above analysis, which looks at the legal trade. Here, the UNODC looks at the different dimensions of the illegal trade, from the number of seizures and their value, to the breakdown by species, to the role of bribes and illicit finances in the practice.
Some of the findings of the report are a mixed bag, depending on your perspective. After a brief dip in illegal wildlife seizures in 2014 and 2015, seizures spiked in 2016 and 2017. This could be good news, meaning that enforcement has been stepped up and that authorities are getting better at catching illegal activity; on the other hand, it could mean that enforcement activity has essentially remained the same while trafficking has spiked. Perhaps it’s a mix of both, but we don’t know for sure. For its part, the report doesn’t clarify this point, noting that seizure data varies in its quality and meaning: “While seizures are an imperfect indicator,” the report states, “they have the potential to provide important insights when aggregated in sufficient volumes. They cannot be taken at face value or interpreted mechanically, but they represent concrete evidence of criminal activity that is otherwise obscured from view.”
Some of the other findings are much more clear. The report makes a special point of noting how the wildlife trade and poaching are linked to organized crime:
Transnational organized criminal groups operate across borders; their illegal behaviors include laundering the proceeds of their crimes, corrupting officials or engaging in corrupt acts, and actively working to obstruct justice. Such groups make use of sophisticated, complex transportation and finance networks. This report underlines that most of these features are present in the most serious forms of wildlife crime. The size and scale of the illegal shipments documented in this report require complex logistics and strong networks, suggesting the organized nature of these crimes and the involvement of a multitude of individual stakeholders in the trafficking.
They go on further to note that the issue of corruption, and the way that it manifests itself up and down the supply chain, is the key problem to address: “[it] manifests itself in various ways, ranging from officials receiving bribes and colluding with criminals, to abuse of office and embezzlement of resources allocated to wildlife management and protection. Bribes paid to officials can make up a significant part of the overall costs of wildlife trafficking.”
The Pandemic Asterisk & Future Directions
Ever since the world was hit with a global pandemic in the form of COVID-19, it feels like most things we discuss need an asterisk beside them. The data discussed here can tell us a lot about what a “typical year” of the wildlife trade looks like — and it can certainly help to clarify trends over time — but what about 2020 and beyond? What will the wildlife trade look like in a post-COVID world?
2020 was an exceptional year in just about every way. When the world ground to a temporary halt in mid-March, the typical pace of travel halted along with it. As the origin of COVID-19 was triangulated down to an open market in Wuhan, China, conservation groups and many others began calling for an end to “wet markets,” a stance that was mired in racism from the start. Over time, however, many groups have made a more concerted effort to broaden their focus to call for more restrictions on the wildlife trade more generally. Indeed, as we can see from the 15 years of data above, there are a whole lot of live animals that get traded around the world every year, and virtually any of them can act as vectors for disease given the right circumstances.
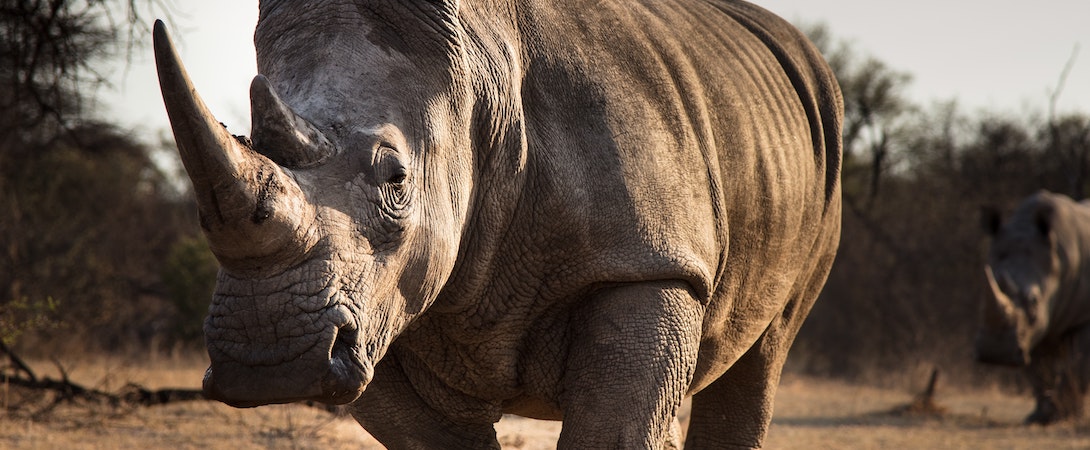
While we can’t yet definitively outline the effect that COVID-19 had on the wildlife trade in 2020, some preliminary data seems to indicate that the slowdown of global travel had an effect in some regions — for example, South Africa reported a 33% drop in rhino poaching in 2020. Analysis done by National Geographic found that ivory, rhino horn, and pangolin scale seizures dropped in 2020 to their lowest levels since 2017, but that same analysis also noted that there has been “an increase in other indicators of wildlife crime, including poaching numbers and online sales of animals or their parts, underscoring the difficulty of drawing conclusions from seizure data alone.” Meanwhile, COVID-19 has most certainly placed further international scrutiny on the wildlife trade in general, and public opinion in countries like China — long a nexus for both the legal and illegal trade, shows strong support for such restrictions.
Are these hopeful signs, or just small blips on an otherwise downward trajectory for wildlife caught in the global trade? With COVID-19 still having such a profound effect on everything internationally, it may be too soon to say. What we do know is that the numbers seem to show that an overall global slowdown — especially in terms of travel, tourism, and shipping — can have a significantly positive effect on wildlife populations around the world. It’s not yet clear what the lasting effects of COVID-19 slowdowns will be, if they will be permanent, or if the wildlife trade will come roaring back to its usual levels (or get even worse). In the meantime, these historical trends can show us where the trade has been, how it has operated, and where it might have weaknesses that animal advocates can concentrate on to make change as effectively as possible.
The original analysis and reporting for this project was completed by Sara Marín López, a Faunalytics volunteer, using the full LEMIS dataset.
We would like to thank Park Foundation for their generous support of this resource and Wildlife Wednesdays.