
Fundamentals
Faunalytics’ Fundamentals are a collection of resources that provide the latest and best data for a variety of important animal issues and topics. What’s more, they present their information in a highly visual “extended infographic” format. Below, you’ll find links to our Fundamentals on farmed animals, research animals, companion animals, and wildlife.
Farmed Animals
The first in our new series of visual “Fundamentals,” our focus on Farmed Animals contains information about animal ethology, consumer opinions, scale of the industry, environmental impacts, and more. See the full resource.
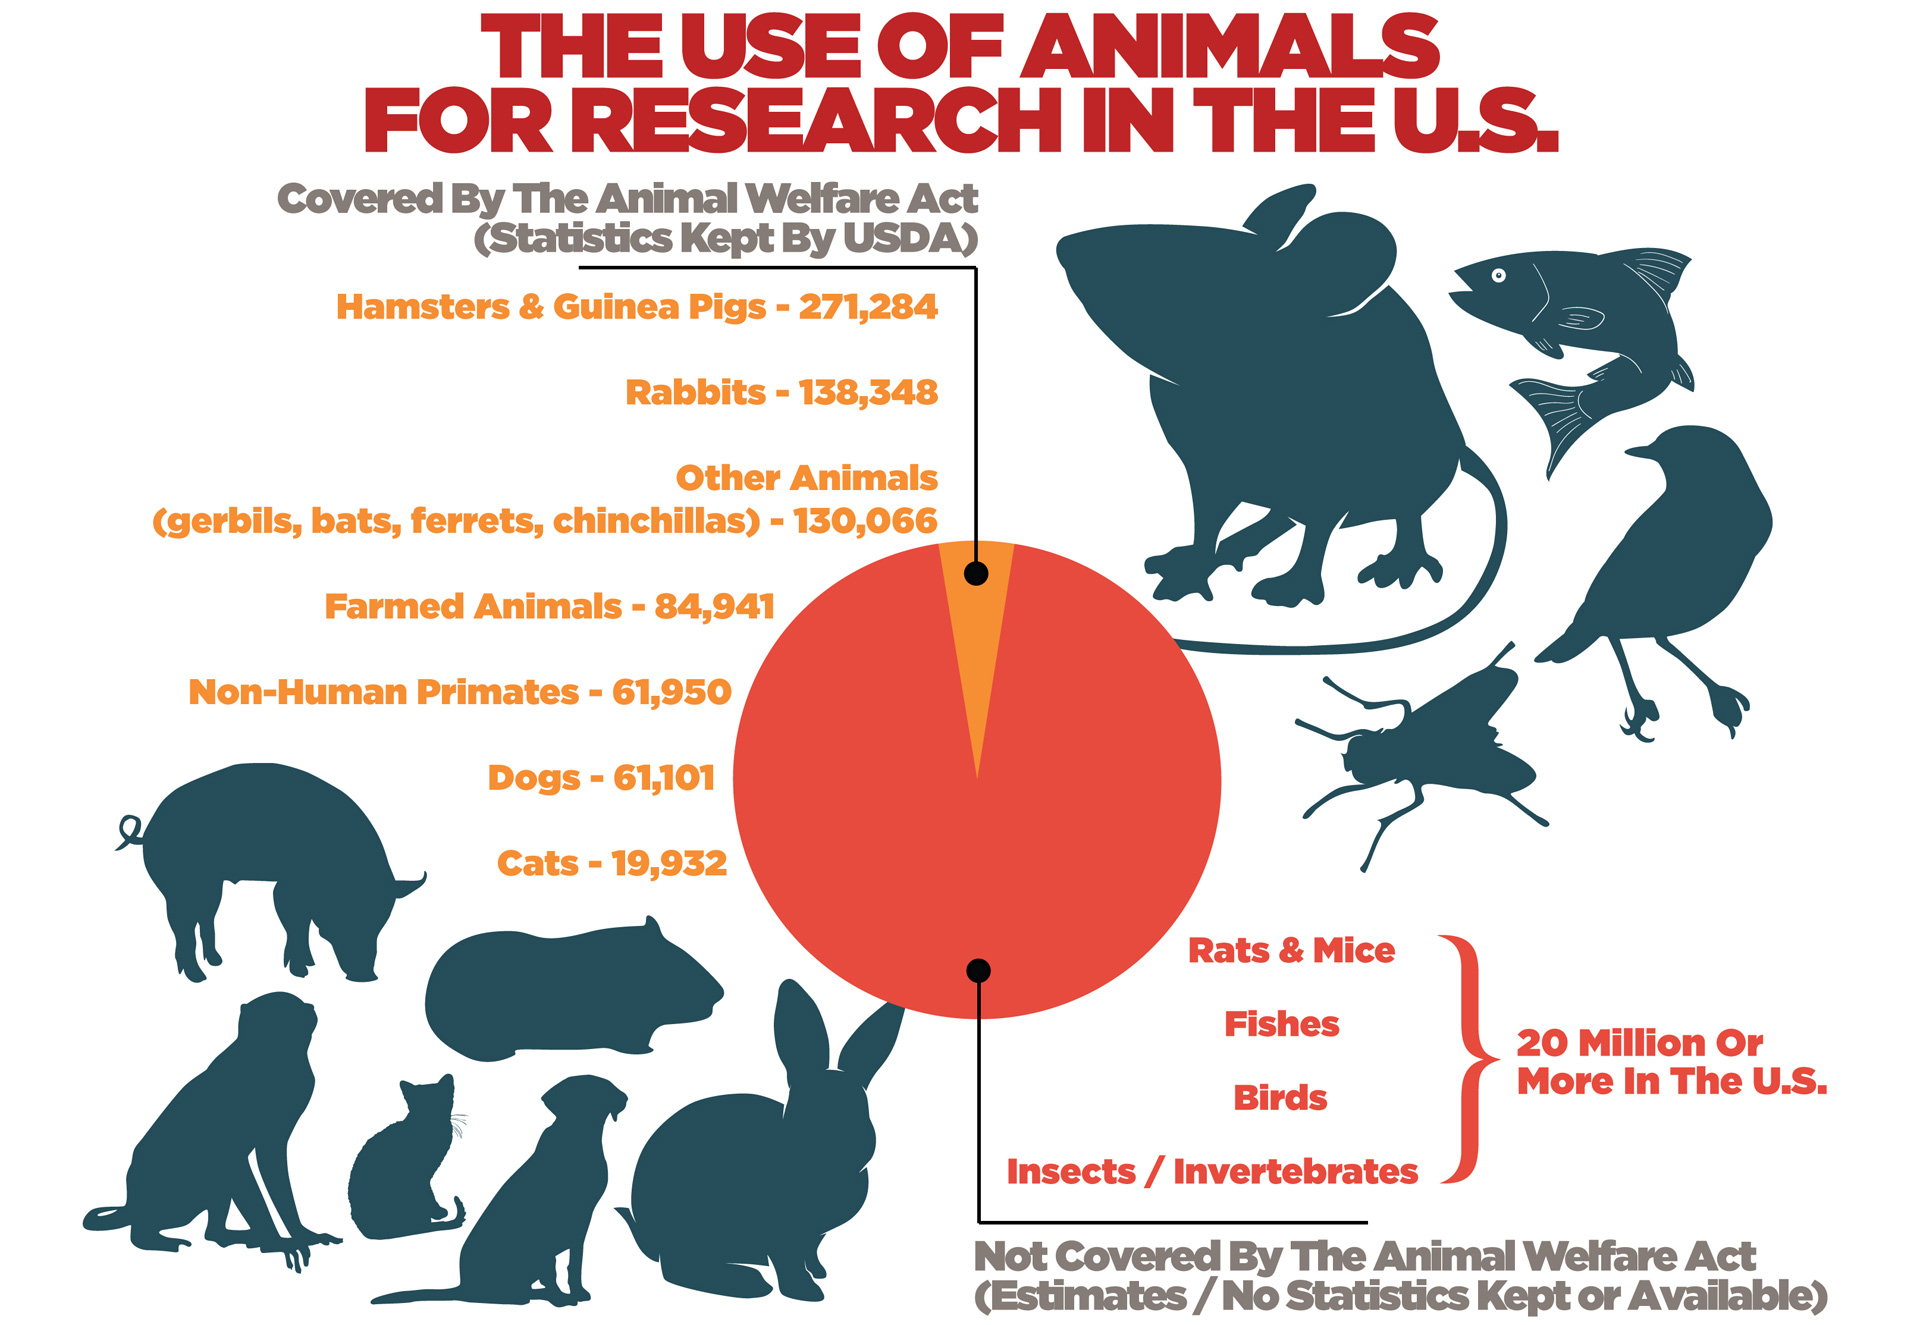
Research Animals
The second in our series of Fundamentals, with a collection of infographics describing the animals most commonly used in research and dissection, the species excluded from the Animal Welfare Act, attitudes, breeding and transport, and research alternatives. See the full resource.
Companion Animals
The third in our series of Fundamentals, with a collection of infographics about the state of companion animal issues in the United States and beyond. This resource covers ethology, breeding, free-roaming animals, sheltering, and much more. See the full resource.
Wild Animals
Our fourth installment looks at the wide world of wildlife, and focuses on the issues where humans have the most negative — and potential for positive — impact. If you want to know more about endangered species, the exotic animal trade, or how zoos affect animals, look no further! See the full resource.
Zoonoses
Our fifth Fundamental looks at diseases spread from animals to humans, also known as zoonoses. We look at the COVID-19 outbreak, but also take a much broader view of the range of different zoonoses out there, and how we can stop their spread before they start. See the full resource.
Ocean Life
Our sixth Fundamental looks at the vast world of the oceans, and the amazing animal life that inhabits them. We take a deep dive into fishing, marine animal conservation, captivity, and more. See the full resource.
Animal & Social Justice
Our seventh Fundamental in the series looks at the ways in which the pursuit of animal justice and social justice are intertwined, and how we can be more holistic advocates. See the full resource.
Invertebrates
Our eighth Fundamental looks at the vast world of invertebrates — a category of animals that includes everyone from fruit flies to octopi — and explores just how much we don’t know about them. See the full resource.
Aquaculture
Our ninth Fundamental is unique in that it looks at one industry in particular — aquaculture — and goes deep into all of its surrounding issues and concerns, including environmental degradation, animal welfare, zoonoses, and more. See the full resource.
Fact Sheets
Why Feed Your Companion Animal A Vegan Diet?
This Faunalytics Factsheet and its associated blog post address some of the common concerns that people may have about the nutrition, efficacy, environmental impact, and economics of vegan companion animal food.
What’s In A Label?: Deciphering And Improving Animal Product Welfare Labels
In this Faunalytics Factsheet and the associated blog post, we give insight into what these animal welfare labels on food packaging actually mean, and how they can be improved.
How To Be A More Effective Vegan Advocate
How Behavior Changes: The Theory Of Planned Behavior
In this Faunalytics Factsheet and the associated blog post, Joy McLeod looks at the root of behavior change, and how animal advocates can promote positive lifestyle changes via attitudes, perceived behavioral control, and subjective norms.
Cultured Meat: Big Promises & Future Potential
In this Faunalytics Factsheet and the associated blog post, Nick Greenaway looks at the issue of cultured meat, examining its attainability as a technology, and the barriers to its acceptance.
Greyhound Racing: A Winnable Issue
In this Faunalytics Factsheet and the associated blog post, Nick Greenaway outlines the current state of greyhound racing globally, and why it’s an industry that we can and should fight to end.
Using Social Norms Messaging Effectively
This factsheet on social norms messaging looks at why and how small nudges and tweaks in language and positioning can add up to a big difference for animals. Read the full blog.
Using Pledges Effectively
Pledges are a useful tool for changing behavior, as Faunalytics’ research on diet advocacy has shown. Maximize their impact with these evidence-based tips!
Tips & Tricks For Effective Lobbying
Lobbying, or working directly with government officials to influence a given issue, can be an effective way to advocate for policy changes benefitting animals. This factsheet presents key tips and tricks from our Legislative Advocacy blog.
Lobbying Vs. Ballot Initiatives
This factsheet presents pros and cons to keep in mind when deciding between lobbying and ballot initiatives, taken from our Legislative Advocacy blog.
U.S. Animal Markets & Zoonoses
This factsheet, taken from a guest blog about the health risks of animal commerce, offers important insights on farming, hunting, and zoonotic disease spread.
