Infographic: Vegetarianism In The United States


How many vegans, vegetarians, and semi-vegetarians are there in the U.S.? How many vegetarian meals do they eat? And why do they choose to limit their consumption of meat and other animal products or avoid them entirely? Highlighting the latest research from Faunalytics, the Vegetarian Resource Group, and others, Faunalytics’ new infographic will help you visualize the current state of vegetarianism and veganism in the U.S. Please share this infographic with your friends and colleagues and post it to your blog, website, or Facebook page!
How many vegans, vegetarians, and semi-vegetarians are there in the U.S.? How many vegetarian meals do they eat? And why do they choose to limit their consumption of meat and other animal products or avoid them entirely? Highlighting the latest research from Faunalytics, the Vegetarian Resource Group, and others, Faunalytics’ new infographic will help you visualize the current state of vegetarianism and veganism in the U.S. Please share this infographic with your friends and colleagues and post it to your blog, website, or Facebook page.
– – – – – – – – – – – – – – –
View the Infographic
Click on the infographic below to see the full-size version.
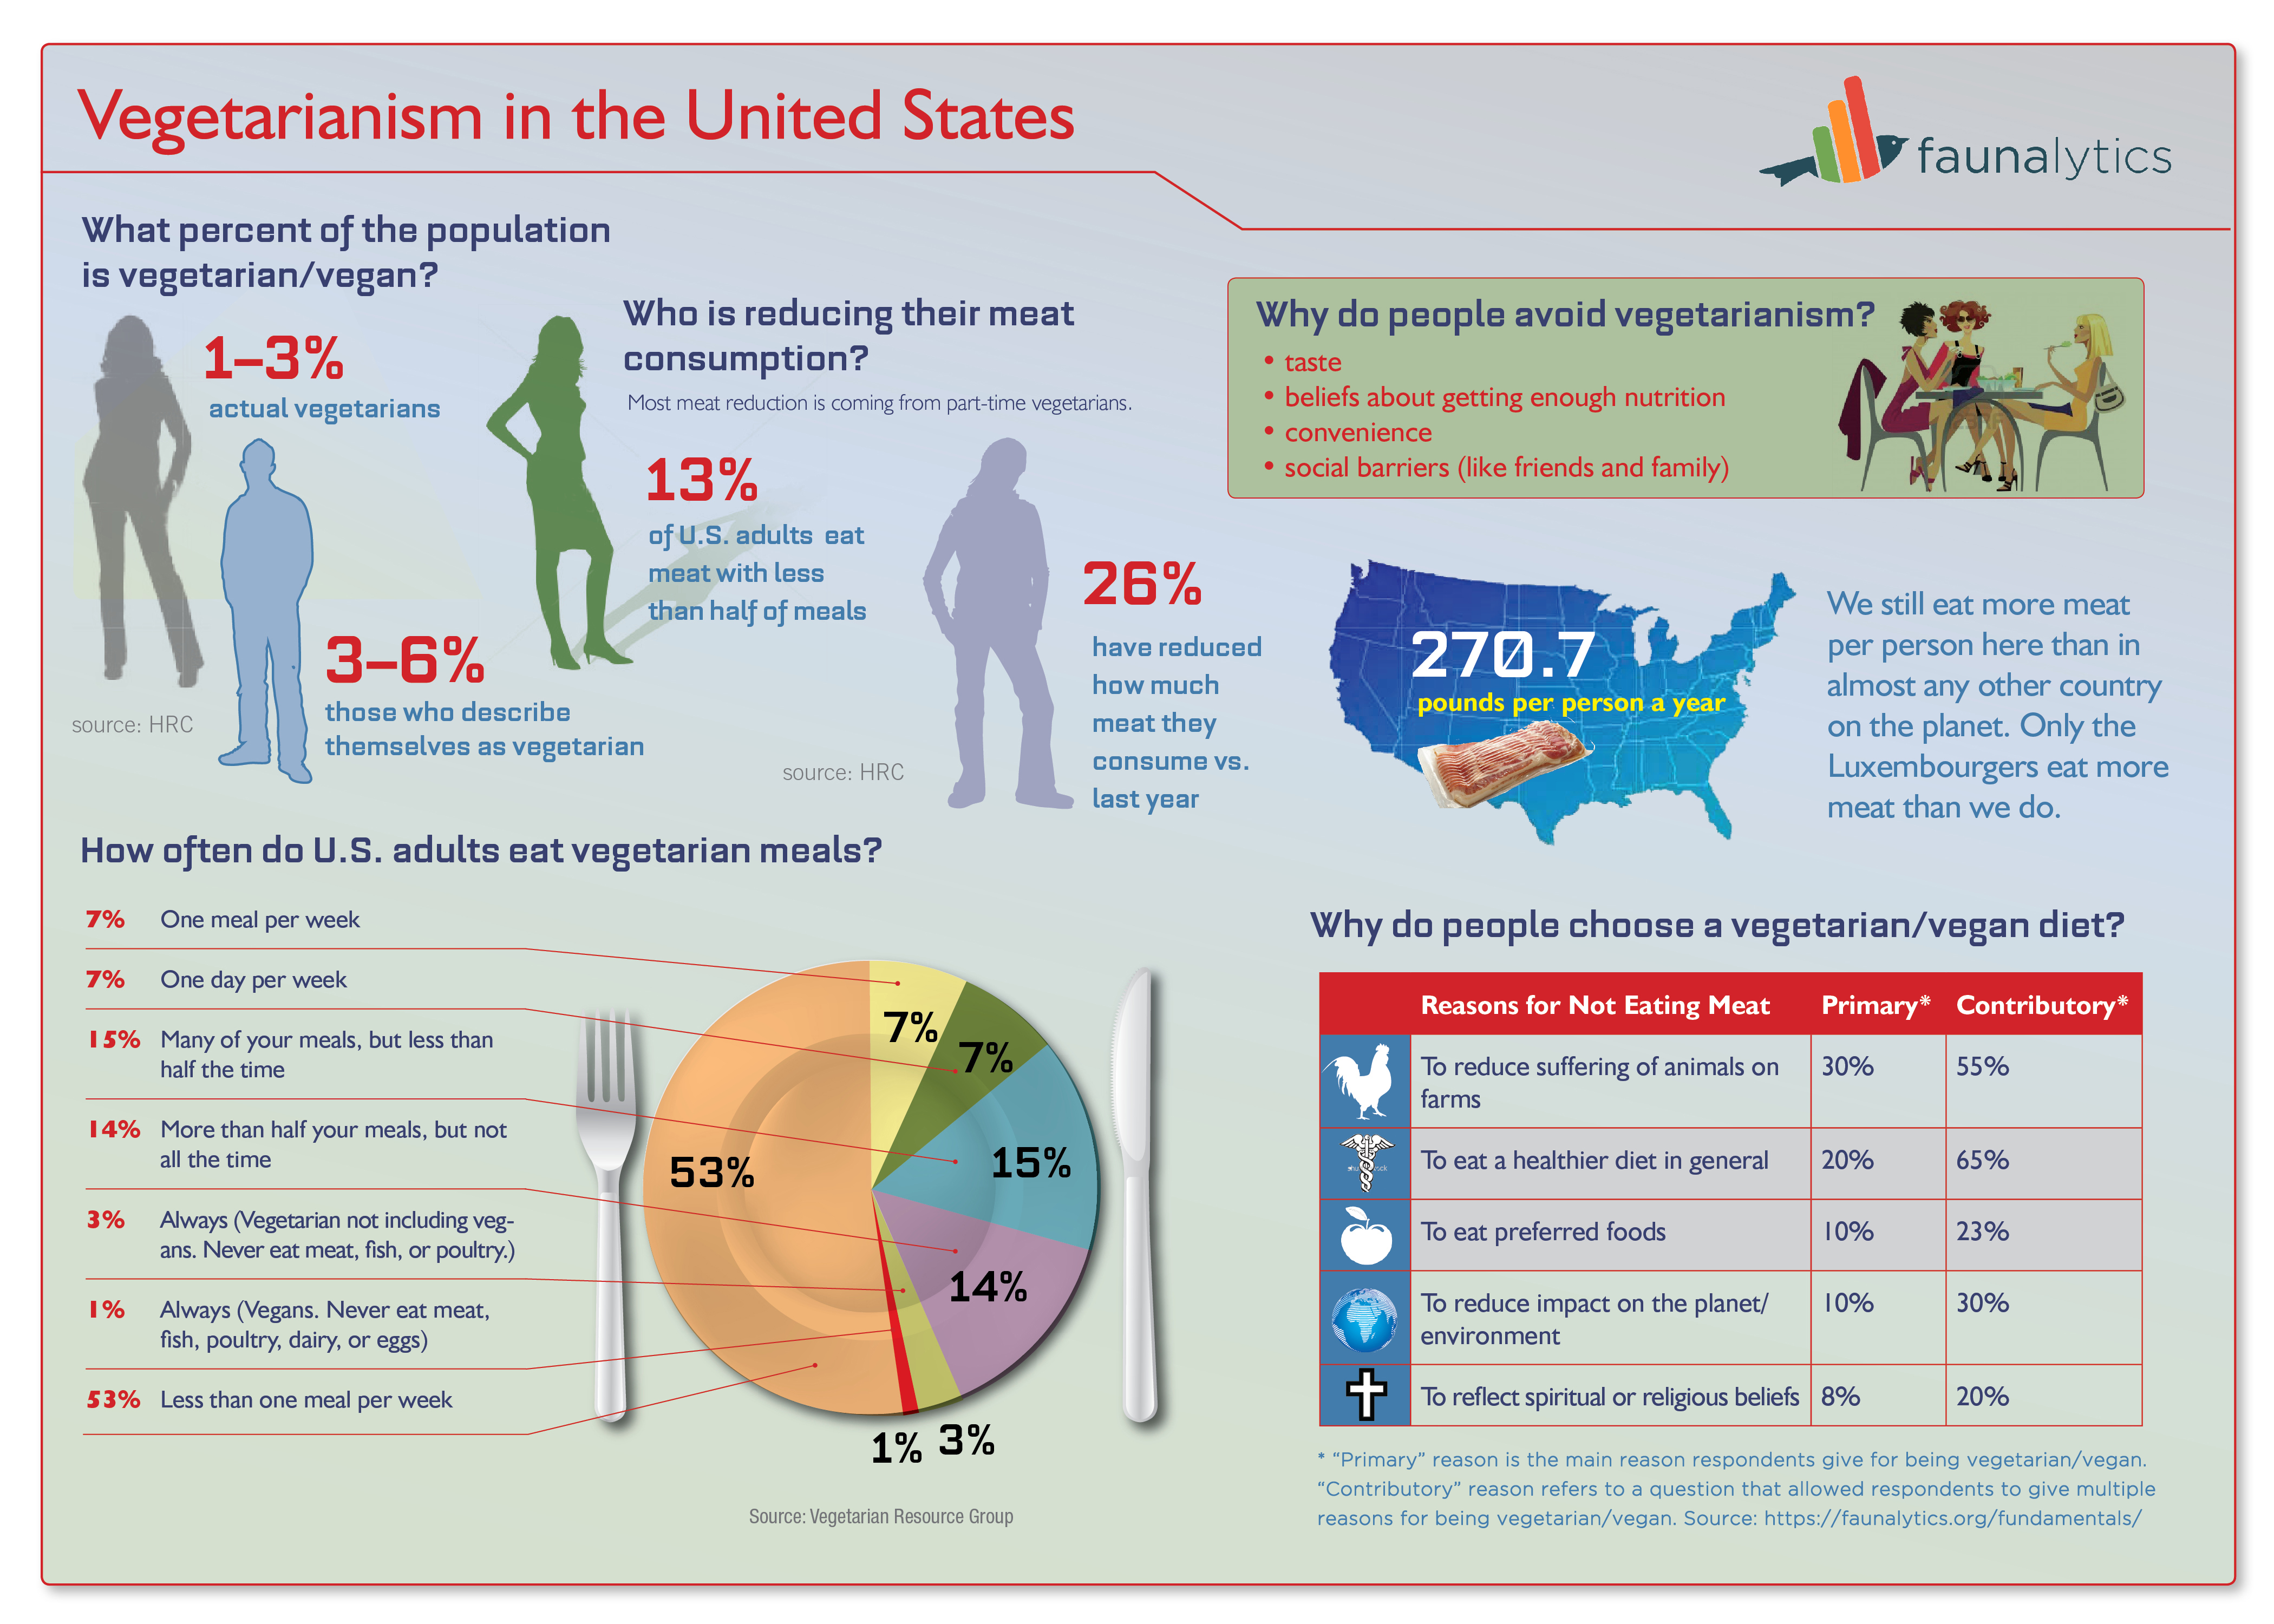
Editor’s note: This infographic was updated on April 1, 2013 to clarify the “pie chart” image and corresponding percentages. See the comments section below for further details.