Using Satellite Imagery To Spot Industrial Animal Farms


Industrial animal farming — characterized by high-throughput systems that confine thousands of animals and operate under centralized corporate control — is expanding rapidly around the world. While some wealthier nations have comprehensive data on these farms, most low- and middle-income countries do not, leaving advocates and policymakers with limited information about the true scale of industrial animal production. This pilot study explored the feasibility of building a global map of large pig and poultry facilities using satellite images and computer vision.
Why Mapping Matters
Farms that can be located can be studied and counted. By pinpointing where industrial farms are established, advocates can estimate how many animals are involved, identify regions that might benefit from stricter environmental regulations, and tailor corporate campaigns to improve farmed animal welfare.
Moreover, visualizing how industrial farms are distributed can help highlight the link between this type of animal agriculture and major societal concerns, such as water pollution, antibiotic resistance, and zoonotic disease risks. Knowing where farms are located is also a crucial first step toward understanding how often they’re affected by climate-related events like flooding — and what happens when they are, including animal deaths and manure pollution.
The Approach
The study’s author trained a type of artificial intelligence (AI) called a convolutional neural network (CNN) using satellite images from the publicly available Sentinel-2 mission. These images cover most of the globe every five days and offer a resolution of 10 meters per pixel — enough to spot big buildings and other features from above. To teach the model what to look for, the author fed it about 10,000 labeled images of large pig and poultry facilities from four regions with reliable farm location data: the state of Iowa in the U.S., as well as Romania, Chile, and Mexico.
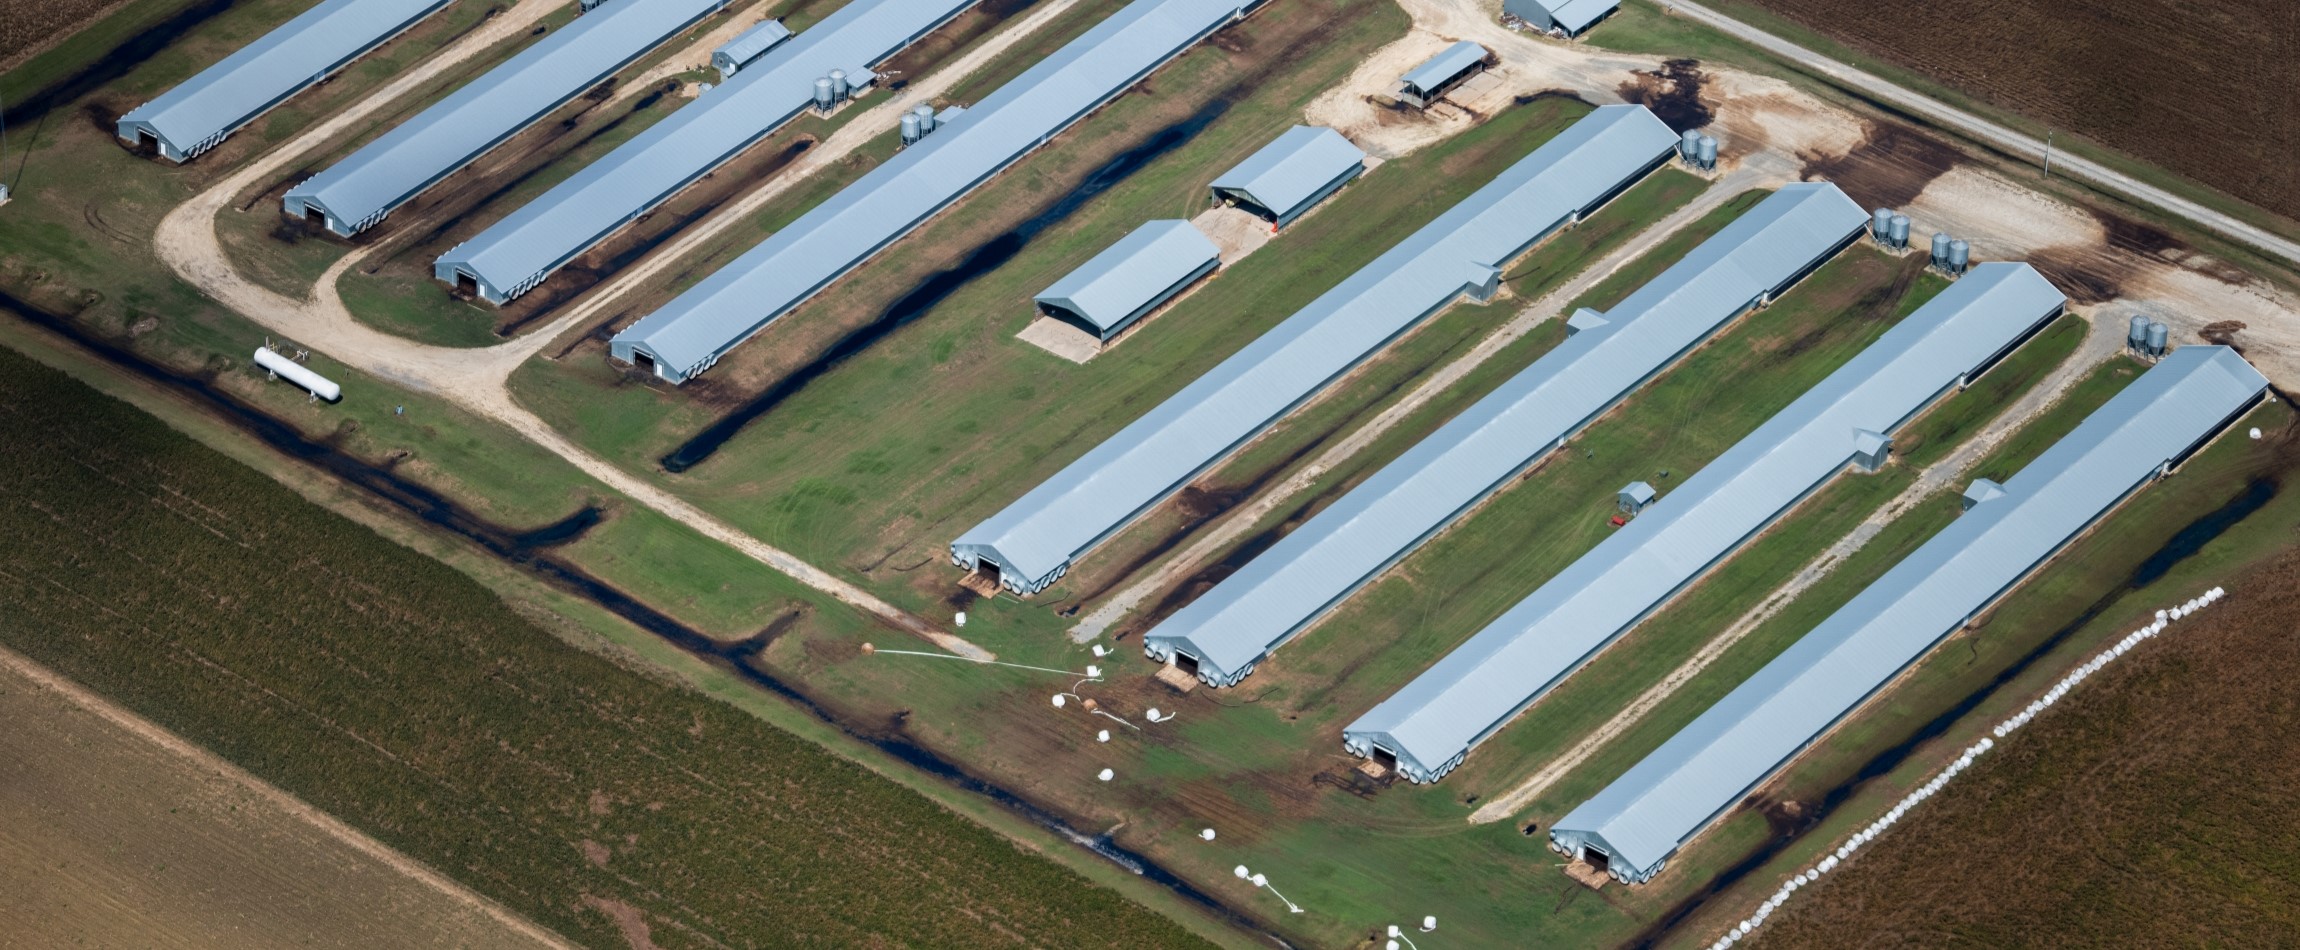
The model learned to recognize visual patterns linked to industrial farming, which might include clusters of long, narrow barns typical of broiler chicken operations, or big, rectangular buildings next to manure lagoons, which are often found on pig farms. Once trained, the model was tested on new areas around the world, especially regions known for high levels of ammonia pollution — a common sign of intensive animal farming. These included Colombia, India, Indonesia, Jordan, Kazakhstan, Malaysia, Peru, Saudi Arabia, South Africa, Sudan, Thailand, Turkey, and Venezuela.
Key Results
In the training countries (the U.S., Chile, Mexico, and Romania), the model performed well:
- 91% of predicted farms were actually farms (precision)
- 89% of actual farms were correctly identified (recall)
In new countries, results were mixed. The model often did well with standard-looking farms, namely long, white-roofed buildings in rural areas, and poultry farms, especially broiler barns. But it struggled when farms had non-standard layouts or were smaller or integrated into urban settings. The model also confused farms with feedlots or industrial buildings.
Still, the model was able to reliably spot areas with lots of industrial farming — especially when it focused on predictions it was most confident about.
Applications For Animal Advocacy
By running the model across whole provinces, states, or countries and zooming in on the most likely farm locations, advocates could get a clearer picture of where industrial animal farming is concentrated. This kind of insight can help highlight areas that might need urgent policy updates, stronger environmental safeguards, or targeted corporate campaigns. For example, identifying farming hotspots in flood-prone regions could provide evidence that industrial animal production — which concentrates and confines animals in high-risk areas — is fundamentally misaligned with the goals of a resilient, sustainable, and humane food system.
Looking back at satellite imagery over time could help reveal when industrial farms were built. This kind of historical analysis may help visualize the spread and growing scale of factory farming — and strengthen the case for earlier, more proactive interventions.
Limitations
In many low- and middle-income countries, animal farms often fall somewhere between small backyard setups and massive, Western-style operations. These mid-sized farms can vary a lot in how they’re built, using different materials or layouts. This makes them harder to spot with a single, global model. On top of that, the Building Footprint Database used in this study may miss a lot of rural buildings in places like China, where mapping data isn’t always available.
Also, while this research focused on farmed pigs and birds (because facilities housing these animals are relatively uniform and distinctive-looking), other species — like farmed fishes and cows — are just as important to track. The author suggests that combining better satellite images, local data, and smarter AI tools could eventually help build a global atlas of industrial animal farming.
Conclusion
As a pilot project, this study shows that AI and publicly available satellite images can help locate some of the largest and most standardized industrial pig and poultry facilities around the world. Although the current approach still misses smaller or less conventional sites, the ability to identify hotspots of intensive animal production is an important starting point. For advocates concerned about the welfare and environmental impacts of industrial farming, these early efforts lay the groundwork for a global map of large animal facilities — a critical tool in future policy, campaign, and disaster-mitigation strategies.