Faunalytics’ 2025 Community Survey Results


I was thrilled to step into the role of Research Director at Faunalytics about six months ago. Since then, I’ve enjoyed getting to know my wonderful colleagues and getting to know so many advocates who work hard every day to end animal suffering. Now, six months in, I’m pleased as punch to bring you the results of our 2025 Community Survey. This survey is critical for Faunalytics, where we aim to convey the importance of using data to set strategy and make evidence-based decisions. Each year, we conduct this survey to help us understand how you’re using our resources, which ones are most helpful, and where we have opportunities to grow to better support the movement.
This blog is a key step in our own annual impact-monitoring journey, sharing the findings from our latest Community Survey with you. Below, we explore the quantitative and qualitative results, and give you a sneak preview of how we plan to make use of them this year and beyond.
Survey Overview
The 2025 Faunalytics Community Survey ran for the full month of May, including during our time at the AVA Summit, and received 632 valid responses with 418 complete surveys (66%). This is comparable to last year’s 654 valid responses — thank you all for your valuable feedback!
Every response is unique and valuable to us — even or especially the critical ones — but it’s also important to think about how representative the sample is. This likely isn’t a truly representative survey of our community because we aren’t able to sample randomly, but if it were, the margin of error would be roughly ± 3.8%. Because of this, it’s best to focus on general trends in the data rather than small yearly differences, and to assume that the extremes are overrepresented: that people with the strongest positive or negative feelings about us are most likely to participate.
Quantitative Results
First and foremost, we’re thrilled to see how happy you are with our work! A whopping 98% of respondents agreed that our work is high quality, which is something we strive for in everything we do; 83% said our work is either extremely or very valuable to improving animal advocacy, on par with last year’s results; and an incredible 97% of you said that you would probably or definitely recommend us to others, which is higher than ever before. We’re grateful for your support in growing our community of informed animal advocates, which is as easy as sharing our sign-up for email alerts.
We’re also pleased to share that our work continues to make an impact for animals and advocates: 77% said that our work has helped guide their advocacy decisions, and 79% said that it’s improved their own or their organization’s advocacy efforts. Best of all, 70% of respondents said that Faunalytics’ work has helped them or their organization reduce suffering and save animal lives, which is an increase from last year, and higher than ever before. This is an incredibly high bar to meet as an organization doing indirect work, so this feedback is extra meaningful to us. We are heartened to know that our work is being applied directly to decrease suffering and save animal lives.
The majority of respondents (75%) have used our Original Research studies, 55% use our Research Library summaries, and 34% have used our Fundamentals. Use of our Original Research has spiked in the past two years, and we look forward to adding more topics to the Original Research program.
Community Characteristics
Supporting animal protection comes in many different forms, and many of you contribute on your own time: 42% of Faunalytics’ audience is made up of employees at non-profit animal protection organizations, while 54% of Faunalytics’ audience is made up of volunteers, independent advocates, academics, and students.
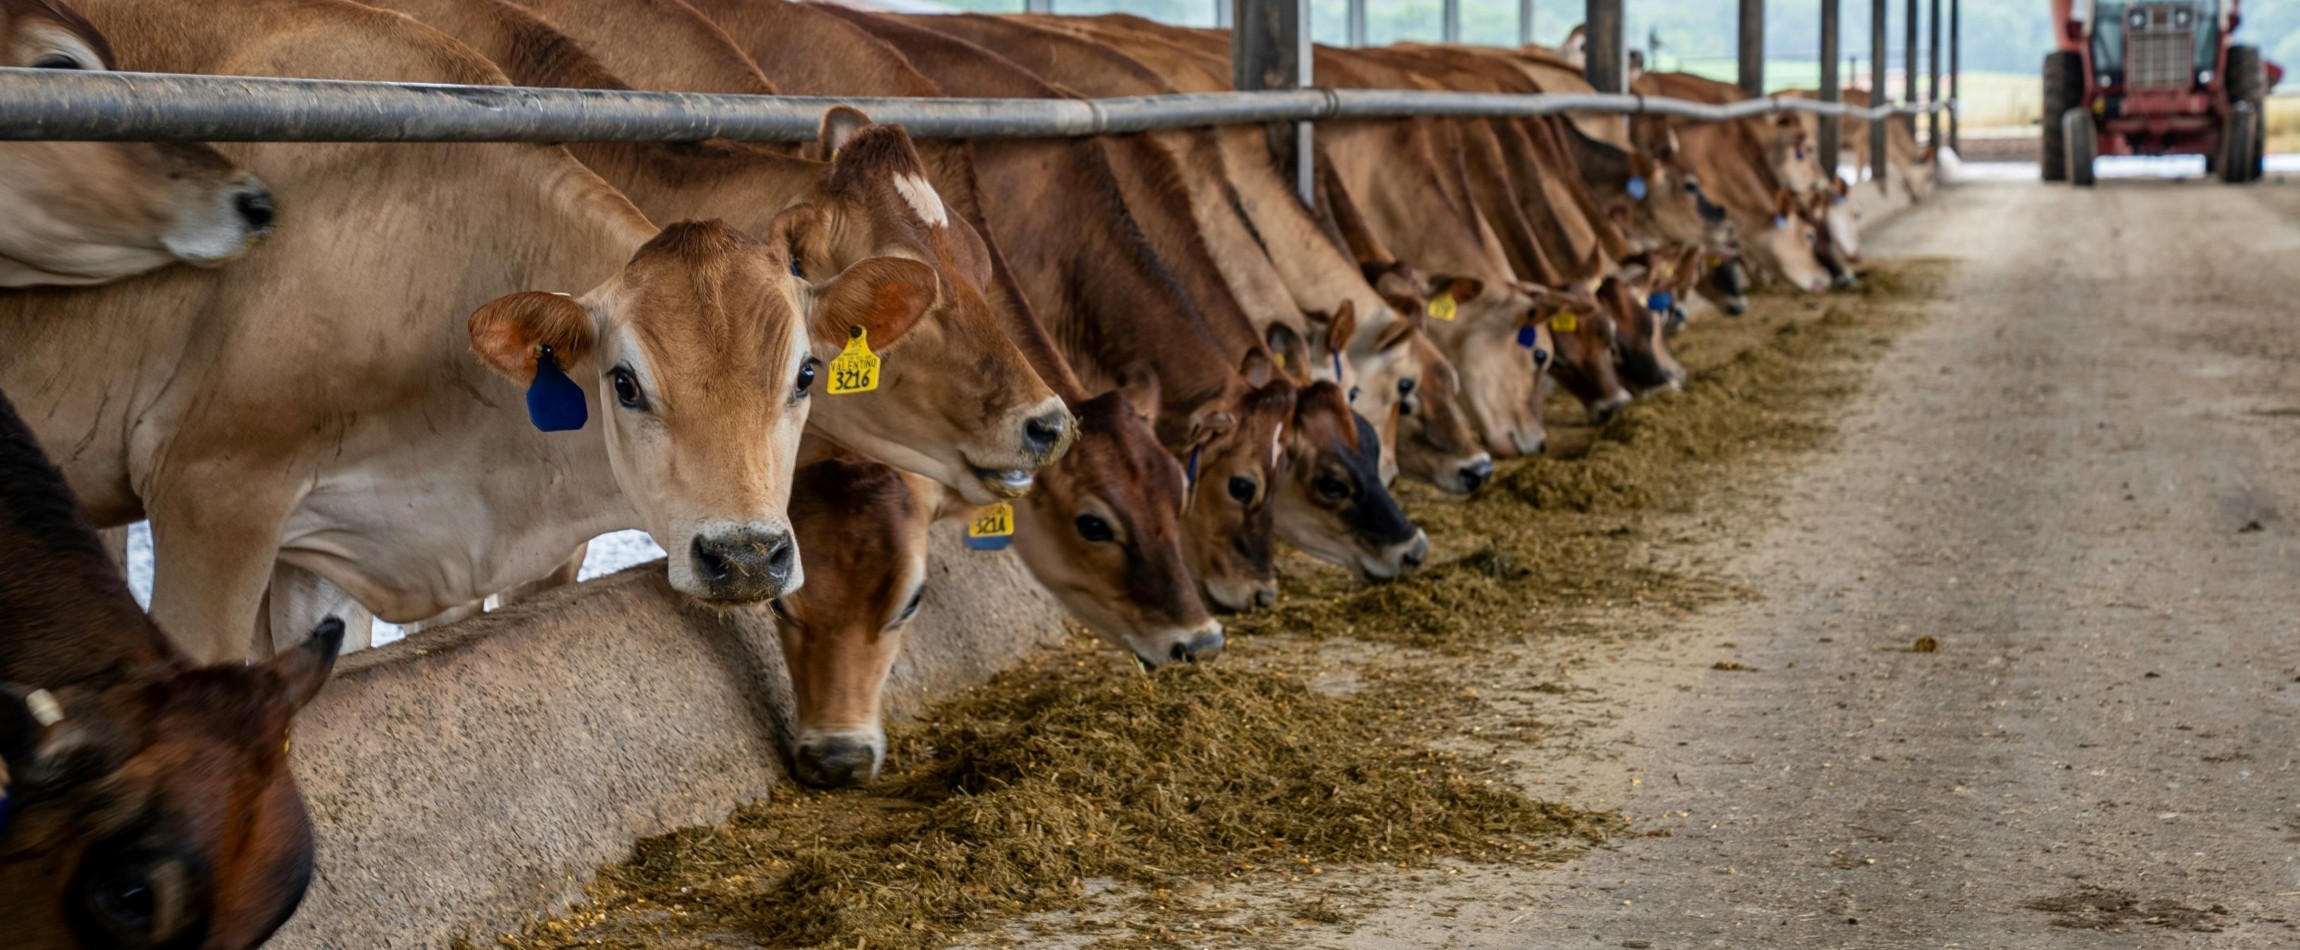
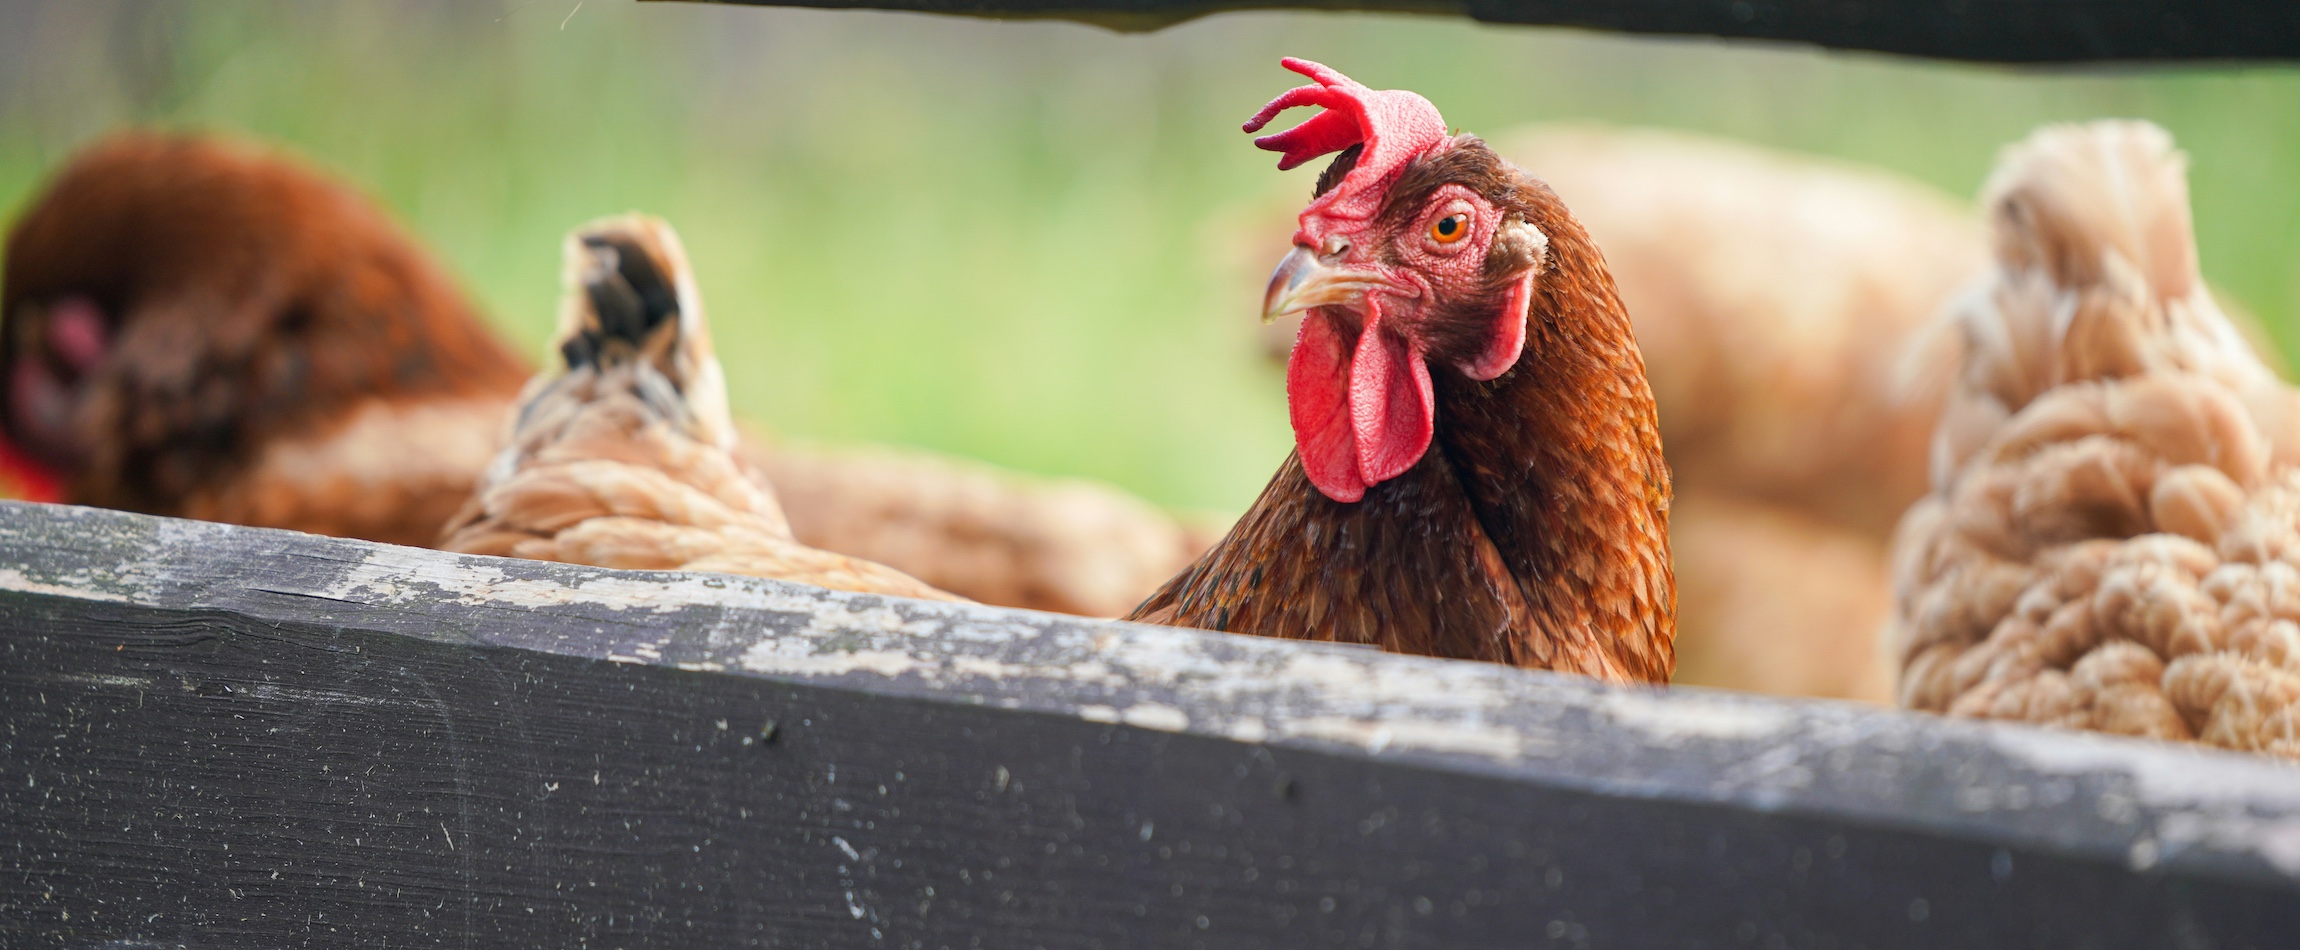
Similar to previous years, the vast majority of our audience is primarily focused on animals used for food (69%). In comparison, 7% are focused primarily on companion animals, 6% on wild animals, 6% on animals used in science, 1% on animals used in entertainment, and 1% on animals used for fashion and textiles. The remaining 9% of respondents selected “other,” providing either more general or more specific answers.
Because Faunalytics bridges different types of animal advocacy, we always ask participants about their alignment with the Effective Altruism (EA) movement. Similar to previous years, our community spans the whole range of perspectives, from 30% who were unfamiliar or not at all aligned with EA to 14% whose work is completely aligned with EA. In the middle, most of our community (56%) do work that is slightly to very (but not completely) aligned with EA.
Finally, we collect (optional) demographic data about our audience, which helps us support the needs of marginalized and underrepresented advocates. Specifically, respondents shared the following details about themselves:
- 63% women, 34% men, 2% non-binary and other genders
- 19% LGBTQ2IA+ (i.e., Lesbian, Gay, Bisexual, Transgender, Queer, Questioning, Two-Spirit, Intersex, Asexual, and other identities that fall outside of cisgender and heterosexual paradigms)
- 16% Black, Indigenous, or Person of Color (BIPOC)
- 9% people with disabilities
The proportion of people who identified as BIPOC increased this year from 11% in 2024.
Key Performance Indicators
With the exception of first-time website visitors and those who responded “no opinion/don’t know,” respondents provided the following feedback:
VALUE
- 98% of the sample agreed that our work is high quality.
- 83% thought our work is either extremely or very valuable to improving animal advocacy.
- 97% said that they would probably or definitely recommend Faunalytics to others.
- 53% of people often or always turn to Faunalytics first for help finding or conducting animal advocacy-related research.
IMPACT
- 77% of the sample agreed that Faunalytics’ work has helped guide their advocacy decisions.
- 79% said that Faunalytics’ work has improved their own or their organization’s advocacy efforts.
- 70% agreed that Faunalytics’ work has helped them or their organization reduce suffering and save animal lives, up from 66% last year. 22% said “neither agree nor disagree” and 6% disagreed.
KPIs OVER TIME
The graph below shows the percentage of positive values (e.g., very/extremely valuable, probably/definitely) for all KPIs from 2020 to 2025. Most have remained fairly similar over the past few years, but we are very pleased to see 70% of our community say our work has helped them or their organization reduce suffering and save animal lives. This is our most direct measure of impact and the hardest to achieve as a capacity-building organization, so these results are extremely gratifying.
Specific Resources
USE OF RESOURCES
This year, the percentages of people who indicated using each of our main resources are as follows:
- Original research: 75%
- Library summaries: 55%
- Fundamentals: 34%
- Research Advice section of website: 15%
- Video summaries of research: 12%
- Pro bono support: 11%
- Customized Research Ambassador presentations or research webinars: 11%
- Fauna Connections conference: 8%
The Research Ambassador presentations and our Fauna Connections conference are some of our newest offerings. These two items are excluded from the over-time graphs below because this is the first year we asked about them on the Community Survey.
USE OF RESOURCES OVER TIME
Below, you’ll find a year-over-year comparison of the use of our resources. Most results are similar to previous years, though we can see a decrease in the use of Fundamentals compared to previous years — in 2024, Faunalytics did not produce a new Fundamental resource, but instead updated our Wild Animal and Research Animal Fundamentals, and translated both into Spanish.
AWARENESS OF RESOURCES
This year, the percentages of people who were aware of our main resources are as follows:
- Original research: 83%
- Library summaries: 56%
- Fundamentals: 48%
- Research Advice section of website: 24%
- Video summaries of research: 23%
- Pro bono support: 36%
- Customized Research Ambassador presentations or research webinars: 20%
- Fauna Connections conference: 20%
AWARENESS OF RESOURCES OVER TIME
The figure below reveals how our audience’s awareness of our main resources has changed over the past few years. While awareness of Library study summaries showed a decrease from previous years, reported use of the Library (seen above) was steady with previous years, and reported use of Faunalytics to “stay up-to-date on the latest relevant research” (seen further below) polled at its highest number ever. This mismatch in results may be due to confusion over resource nomenclature, and will be something we consider further.
HOW ARE OUR RESOURCES USED?
Since 2021, we have asked respondents how they have used our resources. This year, we continued to ask respondents about the ways in which they use our resources, but with updated wording of our question to try to better capture direct use of our resources. For example, one item originally read: “To improve your advocacy techniques (e.g., outreach method),” and we updated this item to read: “To improve or change your advocacy techniques, tactics, or activities (e.g., outreach method).”
This means that comparing this year’s responses to previous years is not exactly comparing apples to apples — the updates to item wording likely changed how people responded, but it is our hope that these changes allow us to better capture how our resources are being used. Overall, a whopping 96% said they’ve put our resources to concrete use.
People said they’ve used our resources in many different ways, including the following:
- To stay up-to-date on the latest relevant research: 85%
- To improve or change advocacy techniques, tactics, or activities (e.g., outreach method): 44%
- To help choose, improve, or change an advocacy strategy or intervention: 39%
- To increase the credibility of advocacy efforts by using research and evidence in materials (e.g., adding facts, data, or infographics): 35%
- To learn about why research and data are important: 26%
- To help design their own research or impact evaluation: 25%
- To help progress in an animal advocacy career or volunteerism: 21%
- To improve internal governance, HR, communications, operations, or other practices: 9%
- To help obtain funding or increase donations: 8%
- Other ways: 8%
- New item: To find new partners or improve existing partnerships: 8%
WAYS OF USING OUR RESOURCES OVER TIME
The figure below provides a year-on-year comparison of how people use our resources, keeping in mind that we slightly changed the wording of some of our indicators this year and added one new indicator. In places where we see increases, this could be due to the changes in wording. We will be closely tracking resource use with these updated questions moving forward.
First-Time Website Visitors
Visitors who reached the Community Survey via our website were asked whether or not it was their first time visiting the site. 70 first-time visitors responded. 29% of those found us through a Google search, 26% via social media (up from 12% in 2024), 11% from Animal Charity Evaluators, and 7% via word-of-mouth. 27% of first-time visitors indicated they found us some other way — their written responses indicated that approximately 25% of these “other” sources were from AI.
- 44% of first-time visitors said Faunalytics is a good fit for their needs (completely or very much), while most of the rest (51%) said it was too soon to say.
- 31% of people were visiting to look for research on a specific issue, 19% to browse the site, and 15% to read a specific article or blog post.
- 97% said they would probably or definitely visit the site again in the future.
- 84% said they easily found everything they were looking for, 12% with difficulty, and 4% did not find what they were looking for.
Qualitative Highlights
We love numbers and statistics, and the ones above help us understand how Faunalytics’ audience uses our work, especially when looking at trends over time. But numbers are limited, so to get the full story we always read your qualitative feedback thoroughly to get a better sense of what we’re doing well and how we can improve.
At the end of the Community Survey, respondents have the opportunity to share feedback about how they’ve benefitted from our resources and what we can do to make our work more useful. In addition to getting a better understanding of our survey findings, we use these responses to inform our strategy decisions.
Many in our community see Faunalytics as the go-to place to stay up-to-date on the latest research and data in the animal protection movement. As Rebecca Gregson of Lancaster University said:
As an academic, I find that Faunalytics are often ahead of the curve in terms of identifying and researching the needs of the animal advocacy movement. Faunalytics helps me to stay up-to-date with the current direction of the movement so that I can tailor the research I choose to do. This helps my work to have a greater, more meaningful impact.
Another anonymous respondent stated that Faunalytics:
Helps me stay up-to-date on global research in my area of interest with weekly emails and allows me to get through high volumes of work with the provided summaries.
Our community also appreciates that Faunalytics makes research and data more accessible and easy to digest. Respondents shared that by providing study summaries, email alerts/newsletters, and easy-to-digest infographics, our resources make research and data easier to access, understand, and use in their own work.
One respondent stated:
When looking into a new topic of research, instead of directly facing all the papers in google scholar etc it is very useful to read what Faunalytics has on the topic. It helps because information has been filtered, made more easy to process, and provides information about related literature that can be interesting to explore.
Multiple respondents explicitly mentioned that using resources from Faunalytics has helped increase the credibility of their advocacy. As you can see below, respondents mentioned that they used our resources to make their materials more accurate, to better back up their claims with data/facts, and to be more confident about their advocacy decisions and activities. For example, Santina Polky-Link at Animals Unite stated:
When we need reliable statistics to support our work, we turn to Faunalytics. Your research allows us [to] be more confident about the accuracy of the data we share and helps ensure that the materials we publish are credible and well-supported.
In addition, Jesica Bon Denis at Fundación Veg shared that:
Faunalytics’ work has been key to strengthening our advocacy work. The research articles have allowed us to back up our campaigns with reliable data, which substantially improves the quality of the messages we share with decision-makers, the media and the general public. For example, we use their data on public perceptions of certain types of animals and plant-based diets to design more effective and empathetic campaigns. The accessibility of the content also makes it easier for different areas of our team to incorporate it into their strategies.
Many respondents also provided us with examples of how they have used our resources to improve their advocacy efforts this year. From improved messaging and strategy, to more effective resource allocation, to updated program design, animal advocates have been putting our resources to direct use in their efforts in a number of important ways. We were so heartened to read examples of our work being put into action, like the example below from a respondent at Compassionate Nepal:
Faunalytics’ research has been incredibly valuable to our Organization, Karunalaya Nepal, in English: Compassionate Nepal, enhancing the effectiveness of our animal advocacy efforts. Their evidence-based insights have helped us better understand public attitudes toward animal welfare, veganism, and behavior change—especially in a South Asian context. One particularly useful resource was their Study of Effective Animal Advocacy Messaging, which informed how we structured our outreach campaigns.
For example, we began incorporating more empathetic, solution-focused messaging based on Faunalytics’ findings, which led to increased engagement during our anti-animal sacrifice and plant-based diet promotion campaigns in Bharatpur. Additionally, the Global Animal Slaughter Statistics helped us contextualize our advocacy in Nepal within a broader global framework. This made our educational materials for schools and public programs more impactful, as we could link local issues to global trends in animal agriculture. Their digestible data and visualizations allowed us to communicate complex issues more clearly to diverse audiences.
Thanks to Faunalytics’ work, we’ve also begun adopting a more data-driven approach in planning our future advocacy, including surveys to assess community attitudes before and after campaigns. Overall, Faunalytics has made our work more strategic, informed, and ultimately more compassionate toward the animals we strive to protect.
And finally, the direct support we offer via our free Office Hours program is another benefit lauded by the community, with several people thanking Faunalytics’ staff by name in the survey comments. Justin Wilkin of Animal Advocacy Careers noted:
Faunalytics’ resources helped me explore effective interventions while I was an individual. Now that I work in the movement, they continue to provide actionable advice in their pro bono office hours, which I’ve personally used for help on structuring surveys and outreach materials!
Incorporating Suggestions From 2024
Before we turn to your suggestions from this year’s survey, let’s take a look at what we’ve done with your 2024 feedback!
The most common suggestion we received on the 2024 Community Survey was for more research focused on the Global South — Asia and Latin America in particular. To better serve our global community, we now compile all of our translated resources in one place! This hub links to our most useful content for readers of Spanish (with a dedicated microsite), Portuguese, Simplified Chinese (with a dedicated microsite), Hindi, Indonesian, Malay, Tagalog, Thai, and Vietnamese. We are also continuing to partner with the Good Growth Co. to conduct impactful research in Asia, and have multiple studies conducted in 2024 and 2025 that focus on China, Southeast Asia, and other low- and middle-income countries. Further, we aim to continue expanding our global support through our multilingual Office Hours, Research Ambassador project, and conference presentations in multiple countries.
Last year, we also received suggestions to bring in more graphics and concise, shareable findings. This suggestion is one that we’ve been working on over the past few years. It takes time — especially when we need to find a balance with scientific rigor — but we’re gradually increasing the accessibility and usability of our work with simpler writing and more visual elements. We share detailed infographics on our website; many more simple, visually appealing stats on our Instagram, X, Facebook, and LinkedIn; and increasingly include figures and infographics in our our study summaries and Original Research reports, like this one from our recently published report Cross-Movement Collaboration For Farmed Animal Advocates In Southeast Asia. We are also working on ways to generate additional concise and shareable findings, such as generating research posters. Keep an eye on our website and social media for these updates!
In previous years, advocates have also made suggestions about how the accessibility and usability of our website could be improved — and as we hope you’ve noticed, many of them were implemented with our relaunch in 2024! Key features include a clearer structure and more immediate navigation, improved search functionality, and a more user-friendly design.
Constructive Feedback & Next Steps
Each year, we carefully review respondents’ suggestions for improvement. We aim to pull out recurring themes as well as helpful ideas. Specific ideas require additional thought and planning, but key themes include the following:
- More global content: As in previous years, our community is telling us loud and clear that they love the research from countries in the Global South that we share and conduct, and want to see more. The most common suggestion we received on the Community Survey was for more research focused on the Global South — Asia and Latin America in particular. For a number of years now, we’ve been emphasizing global research in our Original Research and study summaries, and now have a sizable collection of translated content on our website. Going forward, we’re continuing to strategize new ways to expand our international scope and involve advocates from traditionally underrepresented regions. Earlier this year, we updated our research prioritization process to more heavily prioritize international work in line with our updated strategic plan — especially collaborative projects in China, India, and Brazil. We’ll also continue to translate useful resources, reach advocates around the world via our multilingual Office Hours, offer customized Research Ambassador presentations, and attend global conferences to get to know our community.
- Advocates want more resources in a number of different formats. One clear theme that stuck out in this year’s suggestions was that advocates want MORE! More translated resources, more video explainers, more webinars, more resources shared on social media, and…well…more! It’s always heartening to hear that people want more and not less of what we do. In the upcoming year, we will work to find ways to create and share more easily digestible and shareable resources across platforms. Currently, we share detailed infographics on our website; many more simple, visually appealing stats on our Instagram, X, Facebook, and LinkedIn; and increasingly include figures and infographics in our study summaries and Original Research reports.
- Respondents made a number of suggestions about specific topic areas for our Original Research and study summaries. Of note, several respondents noted a need for more work on the changing political landscape, and how we can engage in effective animal advocacy and strategy. We have recently conducted studies on how to effectively talk to political staffers, and how to bridge U.S. Conservative values with animal protection. In an upcoming study, we’ll be looking at U.S. voters’ responses to pro-animal candidates. And in line with our updated strategic plan, we will continue to conduct Original Research that aims to directly support animal advocates in a fast-changing political landscape.
Over the coming weeks, we’ll dig into these suggestions and others to identify how we can put them into action. As always, we’ll update you on any changes and improvements we make.
Thank You!
Whether or not you completed our Community Survey, please know that we value your input. If you have feedback on our work, we encourage you to reach out to us year-round and let us know what you think. You can do this by:
- Sending us a message on Instagram, X, Facebook, or LinkedIn.
- Leaving a comment on a blog post or study summary in our Research Library.
- Contacting us privately through our website.
- Dropping into our Office Hours (this is especially helpful if you have questions about what we do or how we do it).
We do our best to respond to every comment and email, but we request your patience, as thoughtful responses take time.
On behalf of all of us at Faunalytics, thank you for completing our Community Survey and helping us improve our work. In the fight to end animal suffering, we’re all in it together.
This year, 180 people entered our Community Survey prize drawing, so we drew two winners. Both winners kindly preferred to donate their prizes to animal protection organizations, so we are happy to announce donations on their behalf to GiveWell’s All Grants Fund and Animals Asia. Thank you for your participation and generosity.
Citations: