Tracking Our Direct Impact: A Case Study Using Process Tracing


One incredibly important source of feedback that we receive from advocates is testimonials, where they tell us specifically about how they used one or more of our resources, and how it affected their advocacy. These testimonials help us understand which resources are being used, and in what specific ways they are helpful for advocates.
Testimonials always give us a chance to pause and reflect on the impact of our work, but in June 2024, we received a testimonial from advocate Keyvan Mostafavi at Anima International France that really grabbed our attention.
“The data provided by Faunalytics on the days of suffering involved in producing various types of animal products were crucial in helping Anima International France estimate the cost-effectiveness of its institutional meat reduction campaign. Without Faunalytics’ work, our analysis would likely have been significantly flawed. Having precise data enabled us to be more accurate in assessing the impact of our intervention on animals, ultimately leading us to completely reconsider our approach to find a more effective way to reduce animal suffering.”
Anima International France had just made a major strategic pivot. They shifted from campaigns focused on institutional meat reduction to cage-free campaigns for laying hens in France, and our data had played a direct role. Keyvan and the Anima team wrote publicly about this decision, describing how a menu analysis of meals served in France, and an estimate of the animal suffering associated with each one, had driven the shift.
We were thrilled! But we also wanted to understand exactly how our Animal Product Impact Scales (APIS) were used, and how this resource contributed to their decision-making.
That question sent us down a (fun!) methodological rabbit hole and into our first-ever process tracing project.
Why Case Studies Matter To Us
Faunalytics’ mission is to help animal advocates be as effective as possible. That means we don’t just conduct and share research because it’s interesting. We do it because we want it to be put to direct use by advocates.
Our work is inherently indirect: our research helps advocates, who in turn help animals. So it’s important for us to understand exactly how that chain works. What resources are being used? How are they being used? What’s making advocates more effective, and what could we do better?
Case studies are one of our most important tools for capturing this. By closely examining a specific use case, we can trace how a resource was found, how it was applied in practice, and what impact it had both immediately and over time. Case studies can also reveal barriers and friction points, helping us refine our resources and the kinds of support we offer.
For us, case studies often begin with a testimonial. From there, we follow up with specific questions to build a full picture of a particular use case from beginning to end. The Anima International France story started exactly this way, but we decided to go further than a standard case study. We wanted to nerd out. So we turned to a method called process tracing.
What Is Process Tracing?
Process tracing is, in short, a formal and evidence-based approach to conducting a case study. It’s been defined as “the systematic study of the link between an outcome of interest and an explanation based on the rigorous assessing and weighting of evidence for and against causal inference.”
In plain terms, you take a specific event, form hypotheses about why it happened, and then look for evidence to see which hypotheses hold up. As Jamie Spurgeon at The Mission Motor, the expert researcher who guided us through the project, put it: process tracing makes you think like a detective. You make predictions about how and why something happened, then gather evidence to test them. As you can imagine, this kind of nerdy detective work was something we gladly jumped into.
The figure below shows each step in a process tracing framework, drawn from Ricks and Liu (2018). In the sections that follow, we’ll walk you through each step and share what we found at each stage of our own investigation.
Process Tracing The Anima International France Case
Step 1: Identify Hypotheses
Every process tracing project starts with hypotheses — plural. You need a primary hypothesis about what you think happened, but you also need to identify alternative hypotheses. What else could explain the outcome? This “three-cornered fight,” pitting your observations against your primary hypothesis and at least one alternative, is central to the process tracing method. It’s what separates rigorous process tracing from simply telling a flattering story.
Drawing on Keyvan’s testimonial, we developed several hypotheses to test. For the sake of clarity and brevity, this blog post focuses on one:
Primary Hypothesis: The Animal Product Impact Scales (APIS) data from Faunalytics made Anima International France’s menu analysis logistically feasible to complete.
Why “logistically feasible”? Because the data in our APIS resource are drawn from public sources. We didn’t collect new data ourselves. What we did was compile, analyze, and present existing data on animal product consumption and the associated number of animal lives and duration of suffering in one accessible place.
The APIS resource provides estimates of the duration of suffering associated with specific animal products (such as battered fish filets, omelettes, and beef ribs), as well as the number of animal lives taken for a serving of different types of animal products. We first published this resource in 2020, with updated data added in 2022 and institutional-level data added in 2023. In theory, advocates could do this analysis themselves. But it would require significant time, effort, and research expertise. Our hypothesis was that our resource removed that barrier, so that Anima could use our data directly in their decision-making model without having to build the analysis from scratch.
That primary hypothesis led directly to our alternative:
Alternative Hypothesis: Internal tooling or specification made the menu analysis logistically feasible to complete for Anima.
In other words, what if it wasn’t our resource that made the difference, but rather some kind of internal analytical tool or script that Anima already had or developed for this project? It’s possible, for instance, that our resource didn’t provide the data in exactly the format they needed, requiring additional processing. In that case, it would have been Anima’s own tooling, not ours, that made their model accurate and feasible. This was a genuine alternative worth testing.
Step 2: Establish A Timeline
Next, we mapped out a timeline sequencing the key events in the case. According to Ricks and Liu (2018), a good timeline clarifies your thinking, establishes how far back you need to go, and identifies which events you’ll need evidence for. Just like any good detective’s case file, the timeline guides everything that comes later.
Our endpoint — the “dependent variable” in research terms — was the moment Anima International France publicly announced their change in organizational strategy. From there, we worked backwards in time to identify the key events that could have shaped that outcome.
We focused particularly on when Faunalytics’ APIS resources were first published and updated, relative to when Anima made their decision.
One thing worth noting is that timelines can change as you investigate. You may find new events, or discover that your original sequence needs updating. That’s a normal and useful part of the process. In our case, we discovered during evidence collection that Anima France updated their website in October 2025, which came before their formal public announcement of the strategy change. We updated our timeline accordingly.
Step 3: Construct A Causal Graph
With the timeline in place, we built a causal graph: a visual map of the sequence of events we’d expect to connect our starting point to our endpoint.
In our case, the starting point (independent variable) was Faunalytics publishing the APIS resource. The endpoint (dependent variable) was Anima creating a decision-making model that was logistically feasible to complete. The causal graph maps the steps that would need to happen in between for our hypothesis to hold.
Step 4: Identify Alternative Events At Each Step
We weren’t done with the causal graph yet. At this stage, we went through each node in the chain (shown in orange) and identified an alternative event or choice that could have happened instead (shown in red). The purpose was to help surface what kinds of evidence might support the alternative hypothesis and could also help generate additional alternatives worth testing.
Step 5: Identify Counterfactual Outcomes
For each alternative event we identified (the red boxes), we asked: if that alternative had happened instead, what outcome would we expect?
This is where process tracing gets genuinely challenging and interesting. The goal is to identify theoretically plausible alternative outcomes, not just any imaginable scenario. This forces you to think clearly about what actually would have been different rather than what you hope might have happened. We added counterfactual outcomes in purple. Note that what we show in this diagram is not an exhaustive list of all possible counterfactuals or the potential links between different counterfactuals and alternative outcomes — for space reasons, and to go easy on your eyes. Our aim is to show clear examples of the counterfactuals we generated rather than to be fully exhaustive.
Steps 1 through 5 are all completed before any data collection. They’re the detective’s preparation work: you establish what you’re looking for and why, so that when you start gathering evidence, you know exactly what to make of what you find.
Step 6: Find Evidence To Support The Primary Hypothesis
Once the causal chains and counterfactuals are mapped, the evidence collection process should be smooth sailing — and that’s exactly what we found here. We had mapped out what we would expect to find for each of our possible explanations, and that directly informed our data collection. This is where all that upfront work paid off.
Before gathering evidence, we also classified the types of evidence we expected to find, using a framework developed by Van Evera. You can learn more about this framework from Van Evera (1997), Collier (2011), and Ricks and Liu (2018). The short version is in the table below.
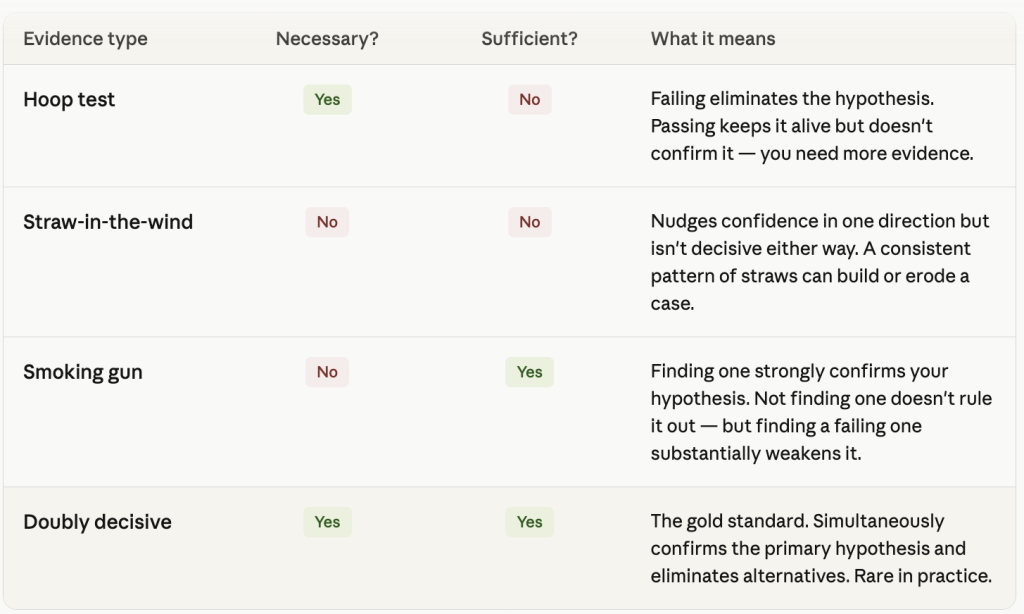
The general idea is that different pieces of evidence carry different weight. A hoop test is a necessary condition: fail it and your hypothesis is eliminated, but passing it alone isn’t enough to confirm the hypothesis. A straw-in-the-wind is neither necessary nor sufficient to support a hypothesis. This type of evidence nudges your confidence towards supporting or refuting, but isn’t decisive on its own. A smoking gun is sufficient on its own: finding one strongly confirms your hypothesis, but not finding one doesn’t rule it out. And a doubly decisive piece of evidence simultaneously confirms your hypothesis and eliminates alternatives. It’s the gold standard, but also rare. We didn’t expect to find one here.
We were fortunate that Anima International France had been very transparent about their decision-making process. That meant a lot of evidence was already publicly available before we ever reached out to Keyvan directly. In total, we gathered:
- Four public posts: an Anima blog post about their decision, two posts to the EA Forum (including one about calculating animal suffering), and a post to LinkedIn
- The original testimonial from Keyvan
- The APIS resource on our website and the OSF repository
- A post from Brian Tomasik on calculating animal suffering, which Anima cited as an early influence
- Anima’s internal decision-making documentation and model (generously shared by Keyvan)
- A structured one-hour interview with Keyvan Mostafavi, Director of Anima International France
After reviewing this body of evidence, here’s what we found.
Hoop Test Evidence
Hoop tests establish necessary conditions. For our hypothesis — that the APIS data made Anima’s analysis logistically feasible — we identified three necessary conditions:
- The APIS data had to have been published before Anima built their model. We confirmed this by checking the publication date on the Faunalytics website and the OSF repository against the dates when Anima began building their model and when Keyvan contacted us with his testimonial. The APIS institutional resources were published in 2023, while Anima built their menu analysis model in 2024. ✅ Hoop test passed.
- Anima had to have actually accessed the APIS data. Their public blog post confirmed this directly. Anima linked straight to the OSF repository, and Keyvan confirmed in the interview that this was their data source. ✅ Hoop test passed.
- The APIS data had to have been used in the decision-making model. When we examined Anima’s model documentation, we found that the suffering calculations for different animal product dishes matched the published APIS data, rounded to two decimal places. The relevant spreadsheet cells linked directly to the Faunalytics OSF repository. ✅ Hoop test passed.
All three necessary conditions were confirmed. The primary hypothesis was alive, but we needed more evidence.
Straw-In-The-Wind Evidence
Straw-in-the-wind evidence is neither necessary nor sufficient on its own. But a consistent pattern of straws-in-the-wind in the same direction helps build or erode confidence in a hypothesis.
We examined four:
- In an early EA Forum post predating his testimonial to us, Keyvan discusses calculating animal suffering at the species level, but doesn’t mention animal product-specific suffering or any data from Faunalytics. One possible explanation: Anima hadn’t yet found our resource and didn’t yet know it was possible to calculate suffering at the product level. This provides some (weak) support for the idea that our data was essential to making their final model feasible. ✅ Straw-in-the-wind passed.
- In his original testimonial, Keyvan states directly: “The data provided by Faunalytics on the days of suffering involved in producing various types of animal products were crucial… Without Faunalytics’ work, our analysis would likely have been significantly flawed.” ✅ Straw-in-the-wind passed.
- Brian Tomasik’s blog post includes a calculator for quantifying suffering by broad animal product categories like beef, turkey, milk, and battery-cage eggs. But it doesn’t provide data at the level of specific food types like omelettes or beef patties. Our APIS data does. This supports the idea that Tomasik’s data alone wouldn’t have been sufficient for the kind of menu-level analysis Anima needed. ✅ Straw-in-the-wind passed.
- In the interview, Keyvan described having to do a lot of searching before finding our resource. He didn’t find it right away, and it wasn’t easy to locate. That’s important feedback for us. It also suggests there wasn’t a more accessible source of the same data readily available. ✅ Straw-in-the-wind passed.
All four straws-in-the-wind supported the primary hypothesis. None cut against it.
Smoking Gun Evidence
Here’s where the case gets decisive. Smoking gun evidence is sufficient on its own to confirm a hypothesis. Finding it strongly supports the claim. In the interview, Keyvan told us directly:
“But what I can say, I think with quite a lot of confidence, is that if I hadn’t found the Faunalytics data, I think both my evaluation would have been less good and maybe I wouldn’t have even done it. I would have used maybe a different framework… Maybe I would just have taken the weight of one chicken and see how many chicken meals you can produce based on one chicken. But since we are not eating, there are a lot of parts of the chicken that we are not eating. Maybe it would have severely biased the final estimate.”
This is as close to a smoking gun as a process tracing project gets. Keyvan states directly, with a fairly high level of confidence, that without the Faunalytics data, the model either wouldn’t have been built or would have been significantly less accurate. ✅ Smoking gun passed.
Summary Of Evidence
Across all three types of evidence, every piece we examined supported the primary hypothesis. Not one piece of evidence cut against it.
Our primary hypothesis is strongly supported: the Faunalytics APIS data made the menu analysis logistically feasible for Anima International France.
Step 7: Repeat For The Rival Hypothesis
Strong support for our primary hypothesis was heartening. But in a process tracing study, this is not the end of the line. Next, we needed to turn that same investigative lens on our alternative hypothesis:
Internal tooling or specification made the menu analysis logistically feasible to complete for Anima.
We already knew from Step 6 that the APIS data did make Anima’s menu analysis logistically feasible. But could other factors have also contributed? Did internal tooling or additional specifications help make their modeling possible? We investigated that possibility using the same body of evidence we’d already collected.
Construct A Causal Graph
First, we constructed another causal graph. Importantly, the endpoint (the outcome) was the same as with our primary hypothesis: Anima’s menu analysis was logistically feasible. But if the alternative hypothesis is true, the preceding events would have looked different. Specifically, it could have been the case that Anima couldn’t use the institutional APIS data in its published form, and needed to perform additional processing or use internal tooling to make the data work in their model.
Identify Alternative Events
Second, we took this causal graph and identified alternative events. For each node on the graph, what could have happened instead? In the figure below, we show some of the alternative events we identified in red as key examples.
Identify Counterfactual Outcomes
Third, for each alternative event, we identified counterfactual outcomes. What different outcomes could have happened if those alternative events took place? In the diagram below, we show those counterfactuals in purple. Note again that the list of counterfactuals we include here is not exhaustive.
Find Evidence To Support The Alternative Hypothesis
With our causal chain mapped, we were ready to analyze our evidence. One practical note worth flagging: we collected all of our evidence in a single data collection phase, then used that shared body of evidence to test all of our hypotheses. That meant drawing on the same sources described in Step 6, but asking different questions of them. Here’s what we found.
Hoop Test Evidence
There was one important necessary condition to meet for this hypothesis:
- We needed to see evidence of additional processing or internal tooling in their model documentation. When Keyvan shared Anima’s model documentation with us, we could see that their analysis unfolded in two steps. The first step involved a spreadsheet using direct calculations from the APIS data. In the second step, they created a Guesstimate model that brought all their data sources together to estimate the total amount of suffering avoided by their institutional campaigns in France. This Guesstimate model calculated adjusted days of suffering for different animal products, weighting duration of suffering by intensity of suffering using data from the Welfare Footprint Institute. The two-step process confirmed that Anima did use additional processing to arrive at their final estimates. ✅ Hoop test passed.
Straw-In-The-Wind Evidence
We had two pieces of straw-in-the-wind evidence to examine:
- In the interview, Keyvan confirmed that the Guesstimate analysis was helpful for their modeling because it allowed them to do sensitivity testing on their final suffering estimates. This suggests the additional processing in the Guesstimate model did help make the modeling more robust. ✅ Straw-in-the-wind passed.
- However, in the model spreadsheet — which forms the basis of their primary calculations on animal suffering — Anima conducted their own analyses without additional internal tooling. Keyvan also described conducting the bulk of the analysis himself, without the assistance of internal tooling. This suggests that internal tooling was not a major part of the modeling process. ❌ Straw-in-the-wind opposed.
Smoking Gun Evidence
We did not find any smoking gun evidence — either in favor of or against this alternative hypothesis. Nothing in our sources definitively confirmed or ruled out internal tooling as a key factor in making Anima’s model feasible.
Summary Of Evidence
The evidence here is weak, but positive. The Guesstimate model was clearly a useful tool. But Anima also conducted most of their primary analysis directly, without the assistance of internal tooling. On balance, this hypothesis is weakly supported.
One important limitation to note: we had a smaller body of evidence that was directly relevant to this hypothesis, which meant fewer distinct pieces to assess. It’s possible that a more targeted round of evidence collection could have revealed stronger support.
In sum, both our primary hypothesis and our alternative hypothesis found some support, just to different degrees. One important takeaway from these results is that more than one explanation of an outcome can be true. And in practice, when advocates use data and evidence to drive decisions, that’s actually a good thing. It’s rare that a single resource is the sole explanatory factor for an outcome, and it shouldn’t be.
Conclusions
We consider our first foray into process tracing both a methodological success and a source of genuinely useful learning for our team. By systematically collecting and evaluating evidence, we confirmed that our APIS resource made Anima France’s menu analysis logistically feasible to complete. Although I was not able to fully cover it in this post for space reasons, I also tested another hypothesis: that Anima’s menu analysis was decisive in driving their decision to change strategy. The evidence I collected provided strong support for this hypothesis, including two smoking gun pieces of evidence. Considered together, these results tell us that our APIS resource made a real difference in guiding a major strategic decision at Anima International France — one that directly increases their impact for animals. As Keyvan told us in the interview: “…we found that ending cages in France would have a ten times bigger impact as winning our previous campaign with collective catering.” That finding directly affirms that our work is making a difference.
We also came away with important feedback. Keyvan put our data to great use once he found it, but it took him considerable time and effort to find it in the first place. Making our resources easier to discover is something we are always in the process of refining.
Process tracing also helped us affirm an important idea: more than one hypothesis can be true. While we found strong support for the hypothesis that our APIS resource made the menu analysis logistically feasible for Anima, we also found (weaker) support for our alternative hypothesis that additional tooling and specification played a role. Although a full treatment is beyond the scope of this post, we also tested a third hypothesis: that the Welfare Footprint Institute provided data that made Anima’s model feasible. Our APIS data captures the duration of suffering associated with different animals and animal products; WFI’s data captures the intensity of suffering. Anima used both sources of data, combining duration and intensity into a single adjusted score. It wasn’t just our resource that mattered, but a collection of resources working together toward a successful final output.
It’s probably rare that any single resource, tool, or piece of information is the deciding factor for an advocate. That’s a good thing. It means the field is building on a richer, more interconnected evidence base than any one organization could provide alone.
We started this post by describing process tracing as a method for pitting rival hypotheses against each other. And process tracing is a very important method that can be used to eliminate counter-hypotheses when possible. But what we actually found in this case is that it’s just as valuable for understanding how multiple hypotheses fit together to explain a complex decision. The real story of Anima’s pivot is that a careful advocate found the right combination of evidence, had the rigor to model it properly, and had the courage to follow the results, even when they pointed toward a difficult strategic change. That’s the kind of advocacy Faunalytics exists to support.
Acknowledgements
This project would not have been possible without the pro bono training, knowledge, and support provided by Jamie Spurgeon at The Mission Motor. The Mission Motor provides free training and support for Monitoring, Evaluation, and Learning (MEL) practices and are an absolute pleasure to work with. If you’re not already familiar with them, check them out. If you’re a funder, please support them!
Thanks also to Keyvan Mostafavi and Anima International France for their openness and generosity throughout this project — for sharing their materials, providing a thoughtful testimonial, and sitting down for an in-depth interview.
And if you’re an advocate who would like to share a testimonial about how you’ve used our research, data, or resources, please email me: [email protected].