Click here to see the full Research Animal Fundamentals
The Research Animal Fundamentals page is the second in a series of “intelligent infographics” that Faunalytics is publishing on different animal issues. Our goal with these Fundamentals is to provide a general overview of the issue while also giving you useful data to help in your advocacy. These graphics and the sources will be updated periodically with the most recent data, so be sure to check back and share our latest infographics.


ATTITUDESPeople have mixed opinions of a secretive industryUnderstanding how people feel about the use of animals in experimentation can be challenging. This is because of a combination of generally low scientific knowledge and the widely differing uses of animals in laboratories. Through our Animal Tracker survey, Faunalytics has been monitoring attitudes and behavior for many years. The study examines how people feel about different animal issues and how those attitudes have changed over time. You can explore the full results here. The Animal Tracker covers a wide range of attitudes related to animals, not just animals used in research. |
||
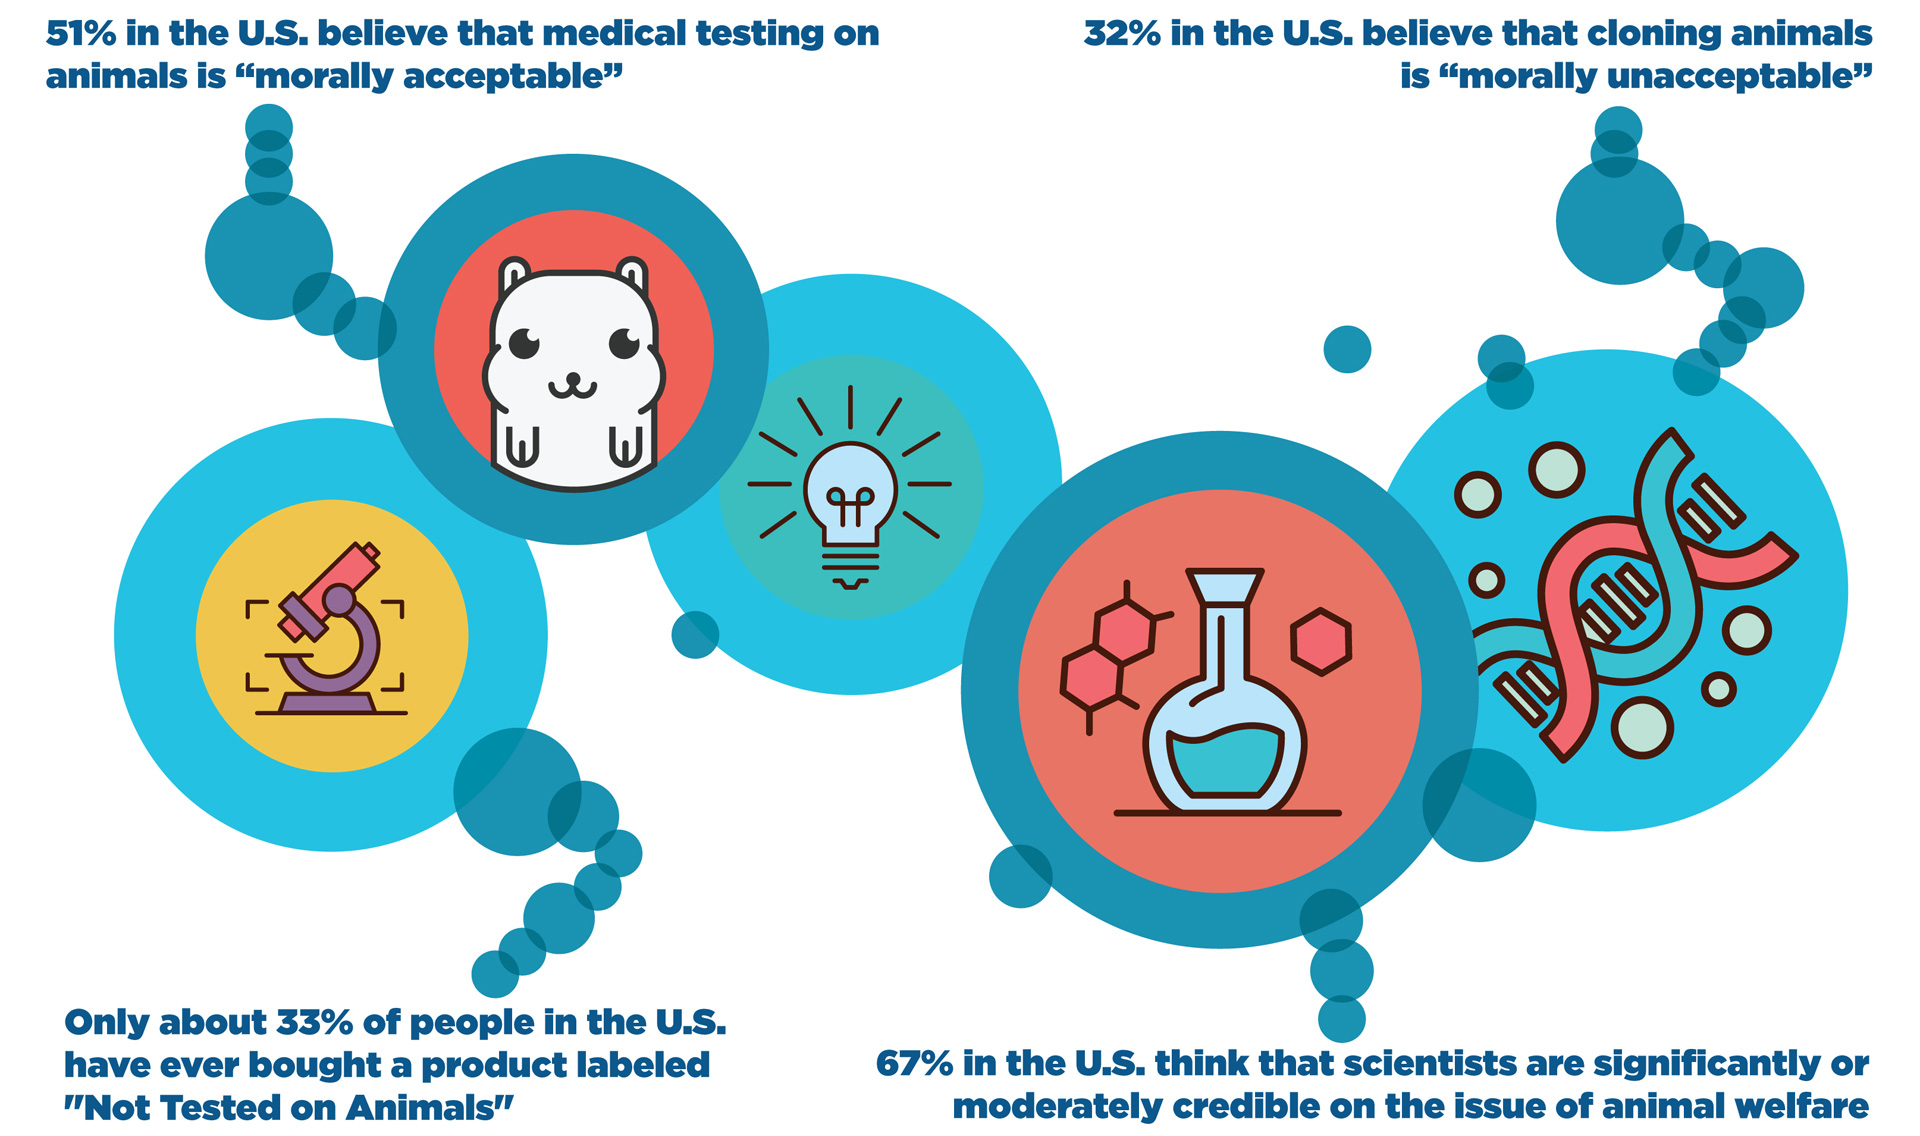 |
The data for the attitudes graphic are pulled from the Faunalytics Animal Tracker and from an ongoing Gallup poll:
|
|
 |
All four of the interactive “Attitude” charts showing changes over multiple years are based on data from the Faunalytics Animal Tracker. |
|
BREEDING AND TRANSPORTConnecting the dots for a global pictureThe worldwide demand for research animals is met by networks of breeding and transport companies. While there are many breeders of dogs, mice, rats, guinea pigs, and other common species in North America and Europe, the more “exotic” animals such as long-tailed macaques come mostly from Asia. The graphic below is largely sourced from investigations and advocacy campaigns that have happened in the last 10 years. |
||
|
Section 1, relating to the capture and transport of monkeys is sourced from investigations by Cruelty Free International (CFI), and from a report under the organization’s former name, BUAV. Sections 2 and 3 are sourced from private investigation briefings from CFI. Because of the sensitive nature of these briefings, they cannot be shared publicly. Evidence of the effectiveness of campaigns mentioned in section 4 can be found here. The information on which airlines still ship primates for use in research in section 5 is also from CFI. |
||
IN THE LABORATORYA partial glimpse of widespread crueltyIt is nearly impossible to fully understand the scope of animal research, and this by design. In many countries, the vast majority of animals used in research are not only unprotected by animal welfare laws, but they literally do not count in statistics. Researchers are not required to track or disclose the number of animals they use. |
||
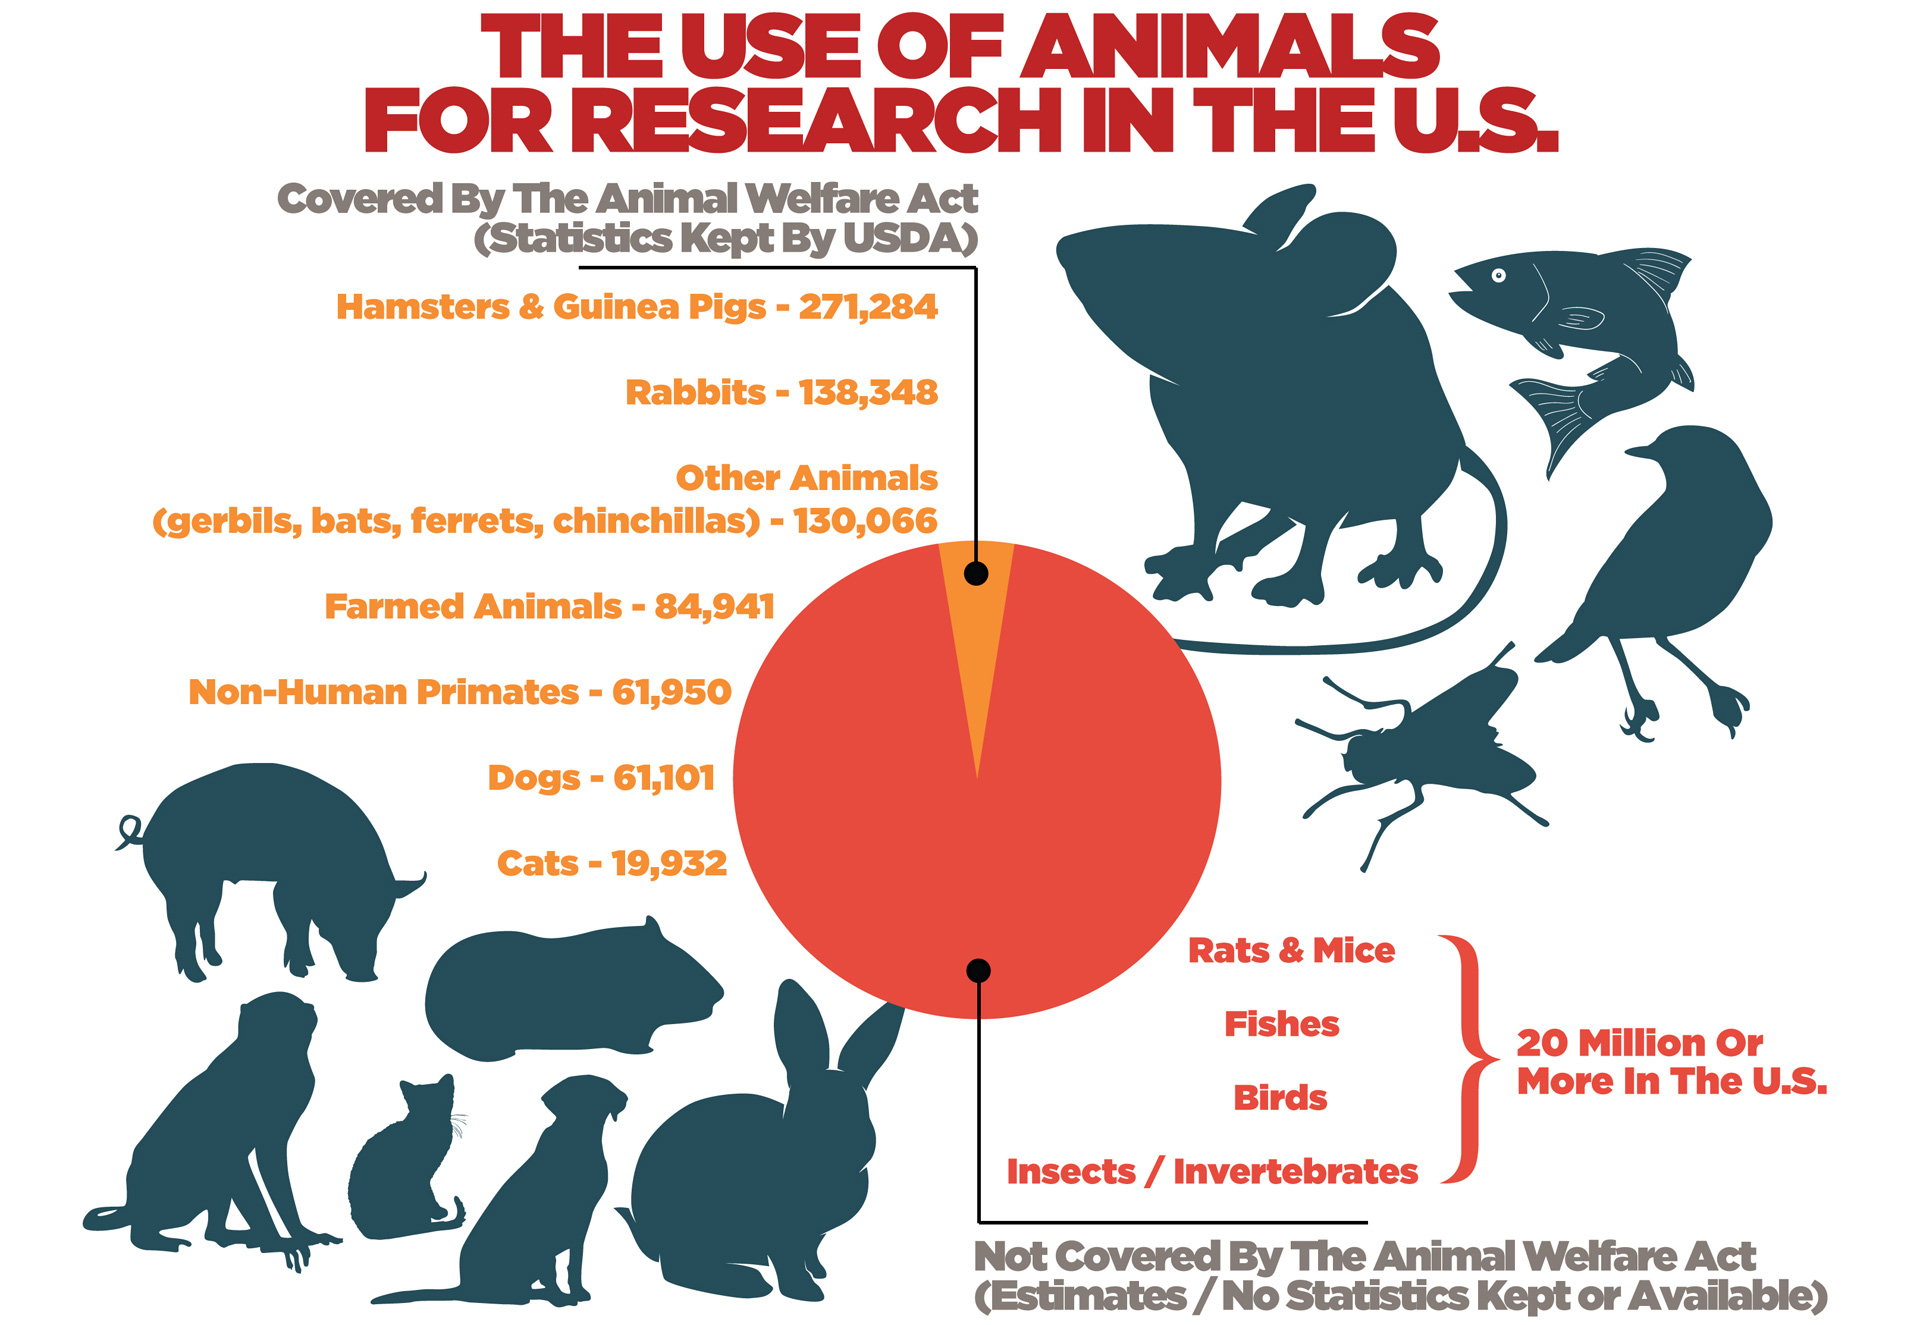 |
The introductory paragraph for this graphic contains global estimates of animal use that are from Cruelty Free International, as well as research by Andrew Knight, DVM. This graphic combines reported data with estimates of animals used in research in the U.S. The exact numbers of animals that are covered by the Animal Welfare Act come from the U.S. Department of Agriculture (USDA) and are also summarized here by the American Anti-Vivisection Society (AAVS). The estimates of the number animals of various species NOT covered by the Animal Welfare Act come from the New England Anti-Vivisection Society, though many other animal advocacy groups have similar estimates. |
|
 |
The heat map of animal research facilities around the U.S. is based on data from the USDA, which has been summarized and made into an interactive and detailed map by the Humane Society of the United States. The HSUS map also includes details about animal testing facilities in each state. |
|
IN THE CLASSROOMStudents increasingly given a choiceAs discussed above, we cannot accurately describe the full scope of animal research because most of those animals are uncounted. Similarly, animals used in classrooms for dissection are also uncounted. As such, the total number of animals used for dissection, listed in the introductory paragraph as between 6-12 million, is an educated guess. The public opinion data on students and adults is from a Faunalytics study conducted for the National Anti-Vivisection Society (NAVS) and by Animalearn, the education division of AAVS. The sources for the chalkboard graphic are below. |
||
 |
|
|
ALTERNATIVESAdvancing science without harming animalsFortunately for animals used in experiments, there is growing interest in rapidly advancing alternatives to animal research. When combined with efforts to reduce and refine animal testing, there is hope that animal experimentation may end within the next generation or two. In addition to the information provided by InterNICHE, FRAME, and resources from the Animalearn Science Bank, readers can explore the dozens of publications in the Faunalytics research library that relate to animal experimentation and research alternatives. |
||
 |
The types of alternatives listed here are summarized from InterNICHE and FRAME Alternatives Laboratory. In the introductory paragraph of this section, there are several statistics related to vaccines, HIV, and neuroprotection drugs, which are taken from this systematic review of animal models. There is also a reference to overestimated effectiveness of drugs tested in animal trials that can be found in this article, as well as a statistic on drugs deemed fit for human use, from NEAVS. |
|