Planting Seeds: The Impact Of Diet & Different Animal Advocacy Tactics
As advocates try to advance plant-based eating, which approaches work best? This infocomic from Caryn Ginsberg explores and explains our groundbreaking study, Planting Seeds: The Impact Of Diet & Different Animal Advocacy Tactics. Click the image below to zoom in, right-click to download and save.

Animal Product Impact Scales
Corporate Commitments To Cage-Free Eggs
Attitudes Towards Animals In BRIC Nations
This comprehensive infographic looks at the results of our study of BRIC nations – Brazil, Russia, India, and China – and their attitudes towards farmed animals. The BRIC countries are among those that kill the most animals for food. While they currently have relatively low per capita meat consumption, they are rapidly increasing their consumption of animal products. The overarching goal of the study was to examine country differences in current meat consumption, recent changes in meat consumption, support for policies to improve farmed animal welfare, attitudes and perceived norms about the importance of farmed animal welfare, and beliefs about the impact of consuming meat. See the full resource here.

Clean Meat: A Primer
People are ready for a change. According to recent research, about 71% of people in the U.S. identify as meat-eaters today, but only 55% of people would like to keep identifying that way in the future. What’s more, 44% of people fail to limit their meat consumption simply because of taste. In many ways, these are the ideal candidates to convert to clean meat. In two graphic primers, Faunalytics explores what clean meat is and why it matters. See the full resources here and here.

![]()
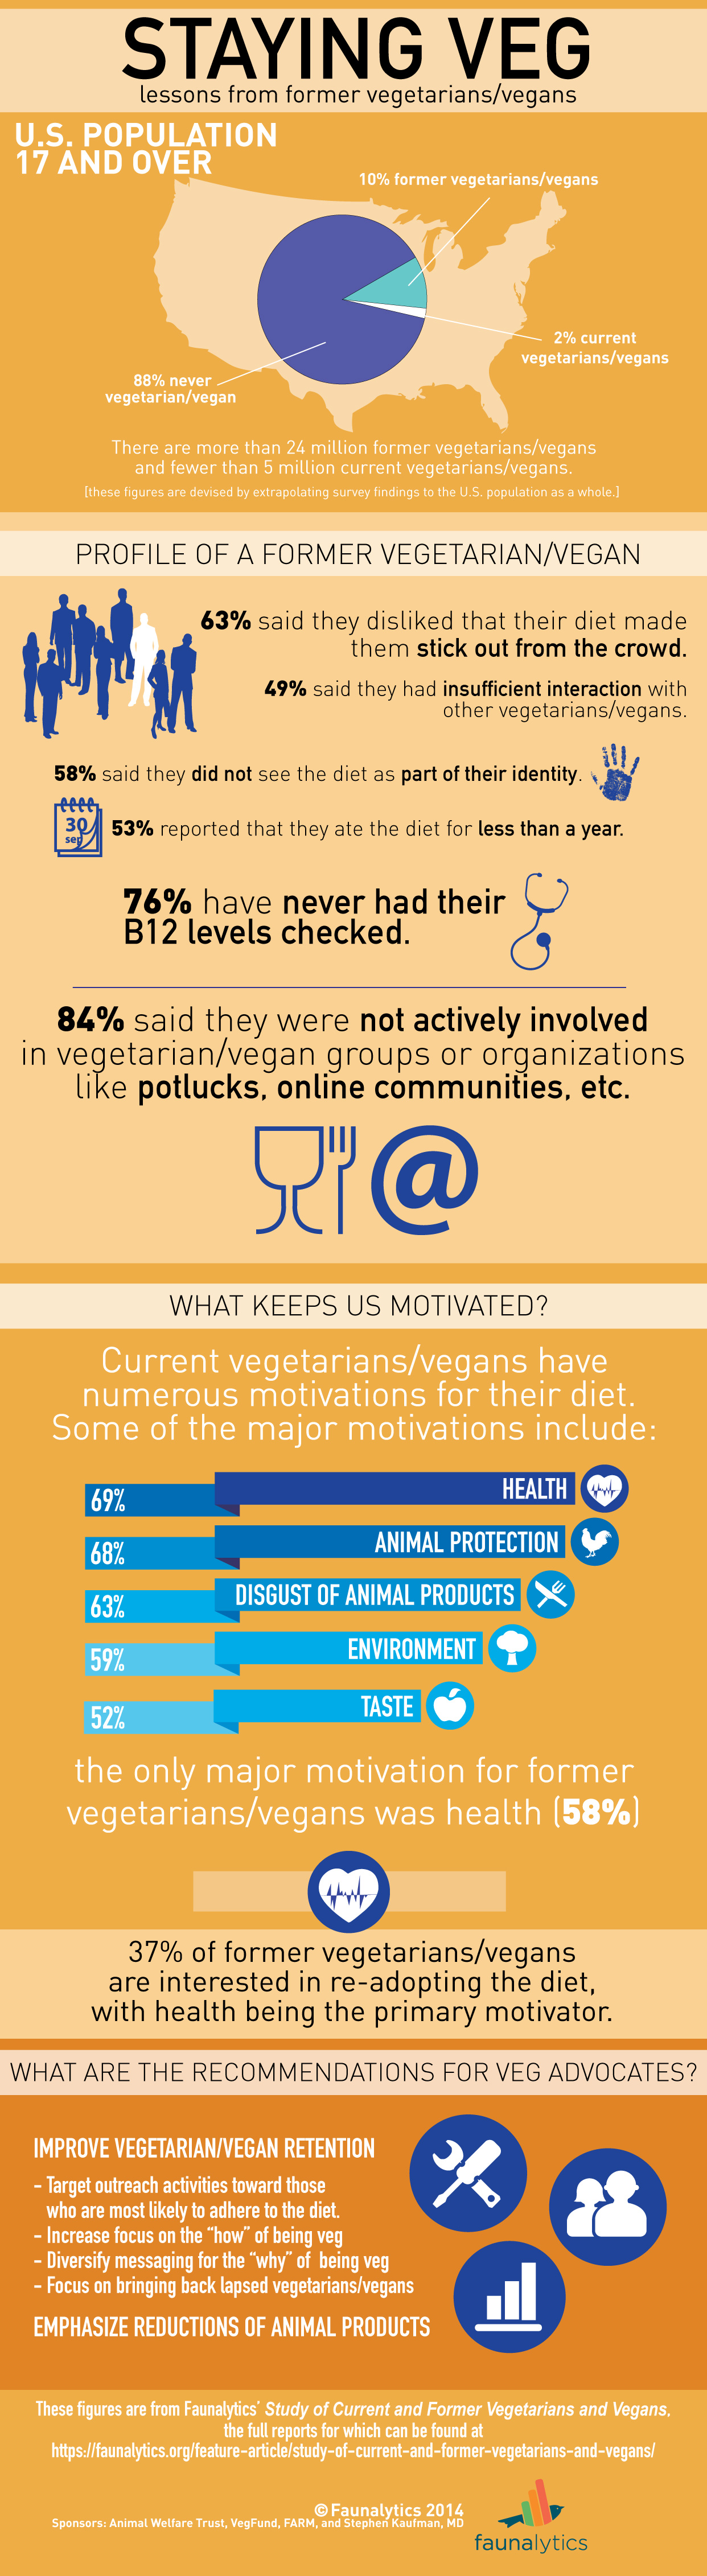
Current And Former Vegetarians And Vegans
This infographic highlights the key findings from Faunalytics’ Study of Current and Former Vegetarians and Vegans. It describes the number of current and former vegetarians and vegans in the U.S., offers a profile of former vegetarians/vegans, and touches on individuals’ motivations for adhering to the diet. It also highlights some potential recommendations for veg advocates to consider.