Steps To A Successful U.S. Ballot Initiative
Roadmap To E.U. Farmed Fish Policy Reform
Zoonotic Diseases In Live Export
#AdoptDontShop: 2021 Shelter Data
The Adventures Of Birdlock Holmes Vol. 6: Beliefs About Chickens & Fishes In The United States
The first in a series of infocomics, this edition looks at the U.S.-specific results of our study, Beliefs About Fishes and Chickens & Their Relation to Animal-Positive Behaviors.

The Adventures Of Birdlock Holmes Vol. 5: Beliefs About Chickens & Fishes In Canada
The first in a series of infocomics, this edition looks at our study, Beliefs About Fishes and Chickens & Their Relation to Animal-Positive Behaviors in Canada

The Adventures Of Birdlock Holmes Vol. 4: Beliefs About Chickens & Fishes In Brazil
The first in a series of infocomics, this edition looks at our study, Beliefs About Fishes and Chickens & Their Relation to Animal-Positive Behaviors in Brazil.

The Adventures Of Birdlock Holmes Vol. 3: Beliefs About Chickens & Fishes in India
The first in a series of infocomics, this edition looks at our study, Beliefs About Fishes and Chickens & Their Relation to Animal-Positive Behaviors in India.

The Adventures Of Birdlock Holmes Vol. 2: Beliefs About Chickens & Fishes In China
The second in a series of infocomics, this edition looks at our study, Beliefs About Fishes and Chickens & Their Relation to Animal-Positive Behaviors in China.

The Adventures Of Birdlock Holmes Vol. 1: Comparing Beliefs About Chickens & Fishes
The first in a series of infocomics, this edition looks at our study, Comparing Beliefs about Fishes and Chickens & Their Relation to Animal-Positive Behaviors across Countries.

How The U.K. And U.S. Media Cover Animal Ag’s Impact On Climate
An infographic that outlines a study summary that we published in our library, looking at how the media connects animal agriculture and animal consumption with climate change.

Do You Know Where Your Fish Comes From?
An infographic that outlines a study summary that we published in our library, looking at how organized crime is intertwined with industrial fishing.

Effective Messaging For Veg Campaigns
A visual summary of a review and blog looking at how focus, content, and framing work together to create the most effective animal advocacy campaigns.

How To Make And Keep A Vegan
This graphic, illustrated by Faunalytics board president Caryn Ginsberg, walks through a series of evidence-based methods to help encourage people to consider, try, and then (importantly) maintain a plant-based diet.

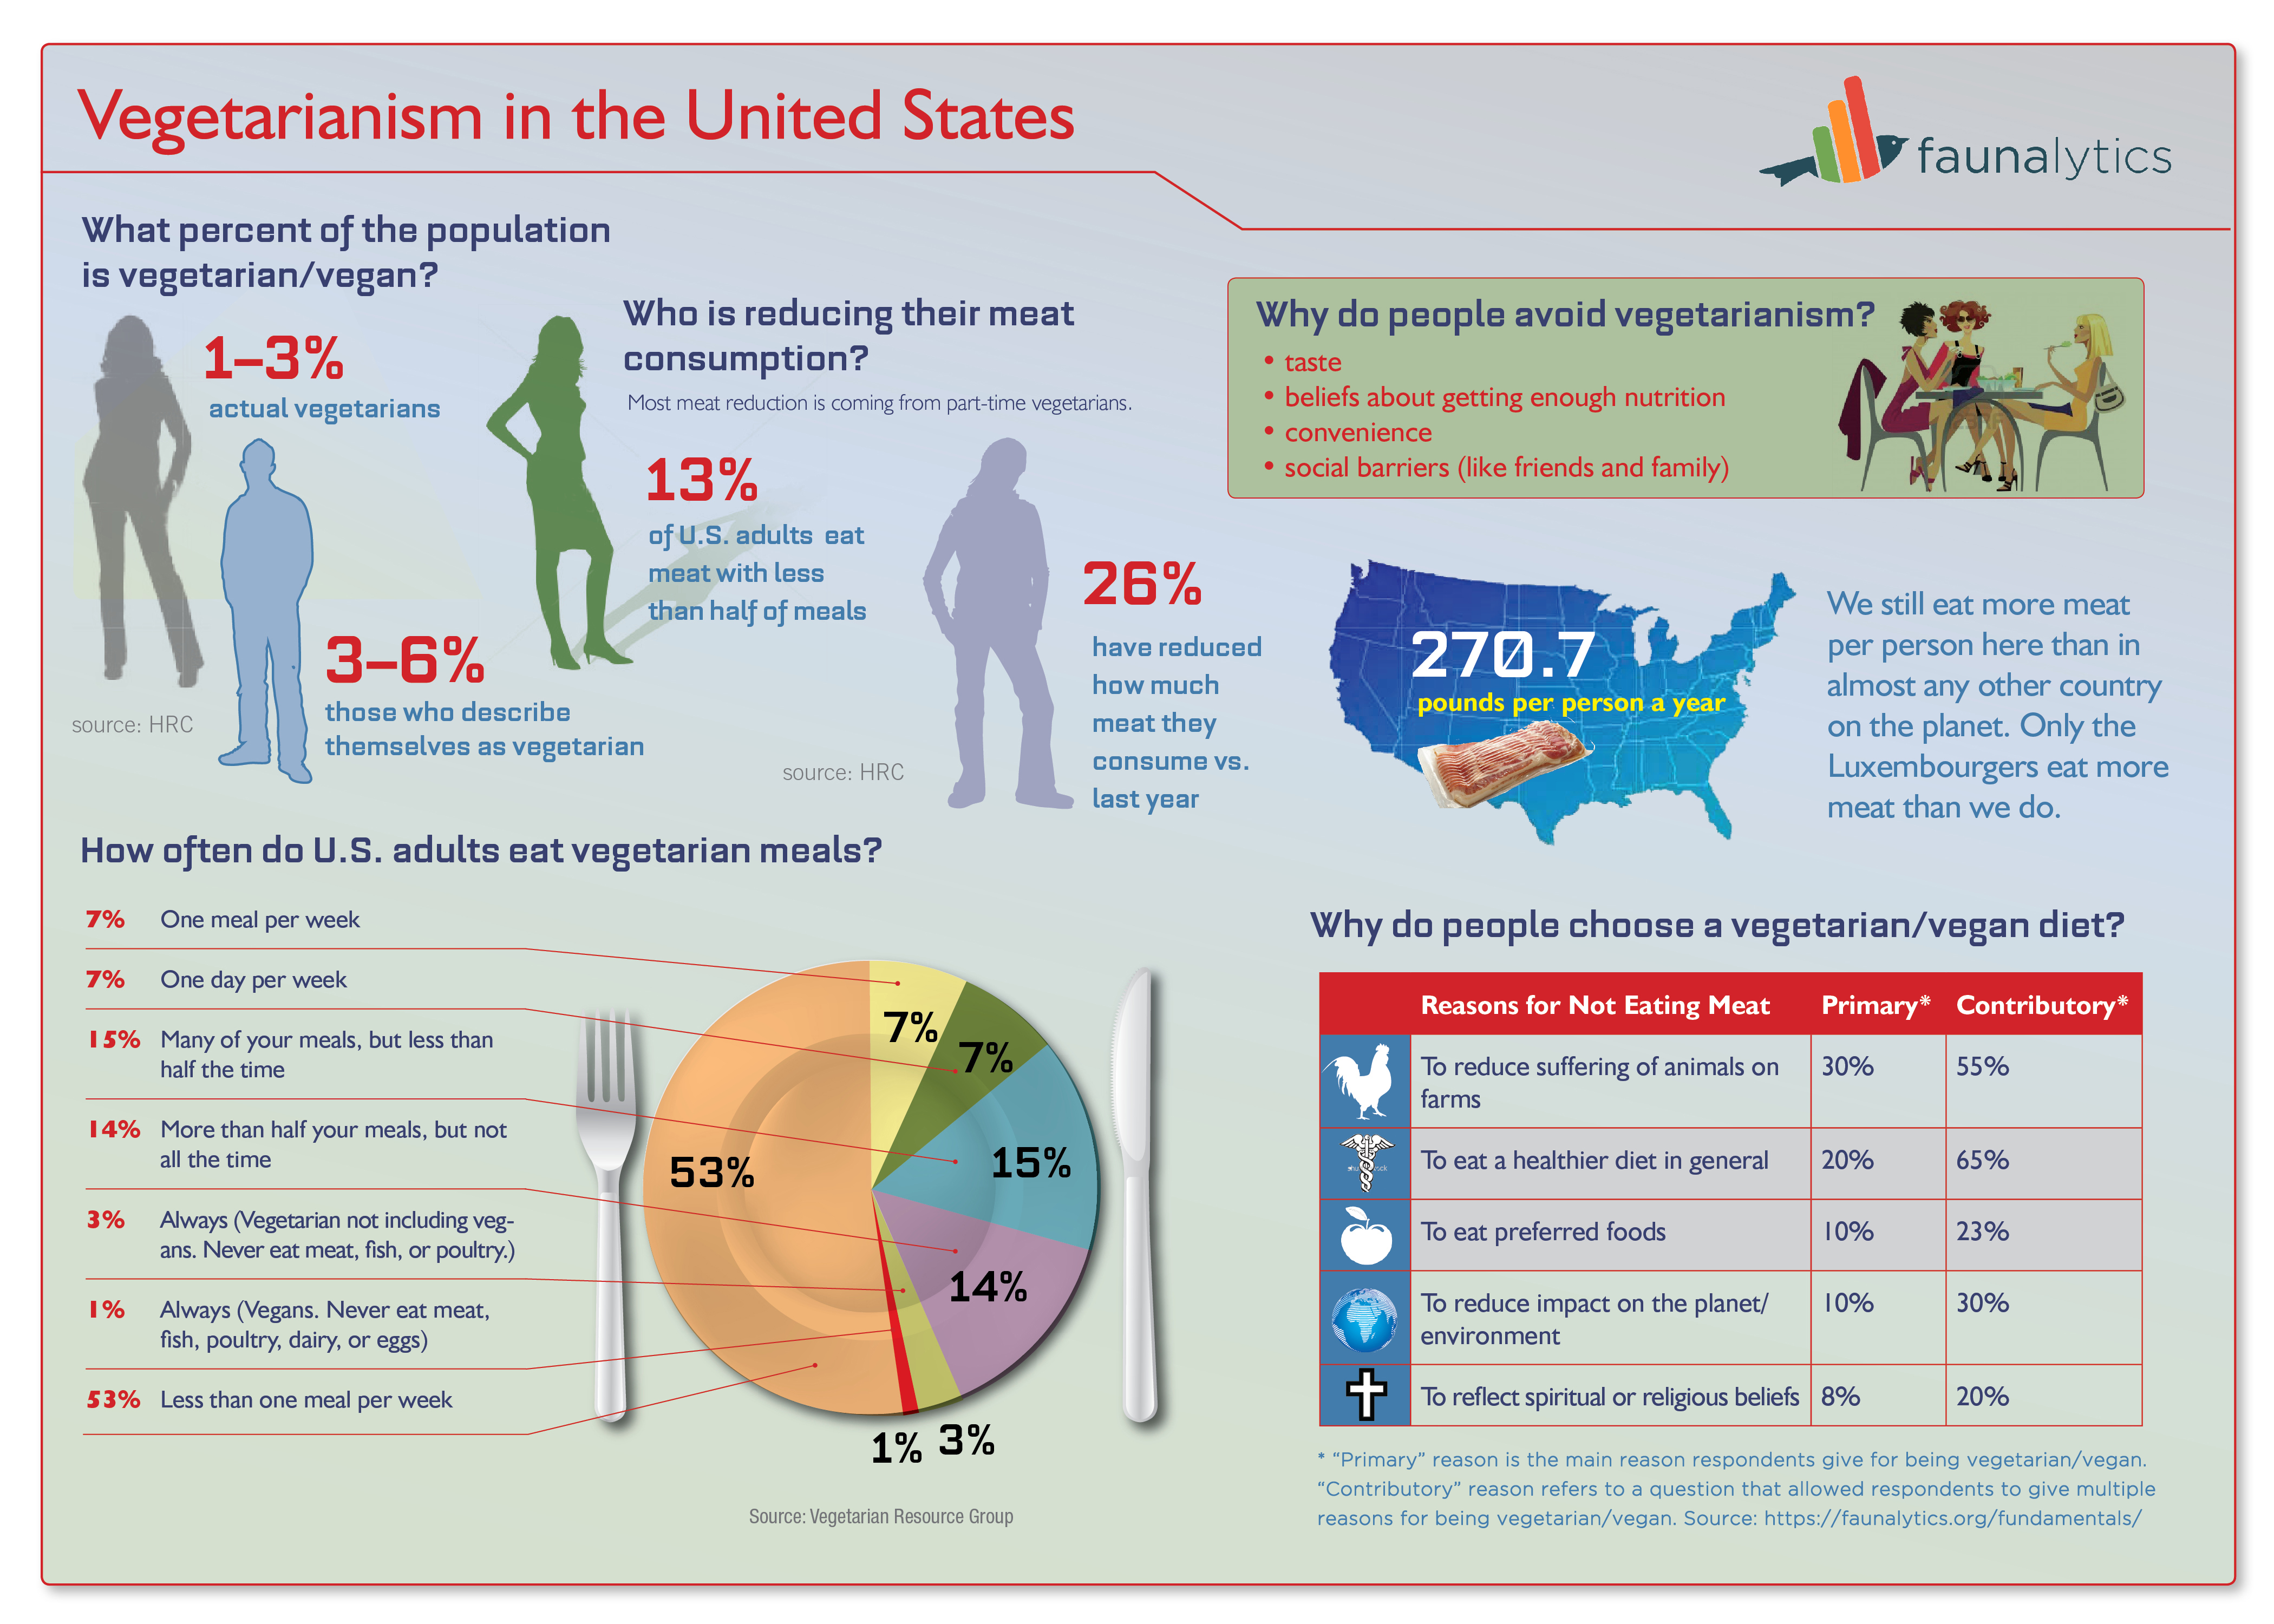
Vegetarianism In The United States
How many vegans, vegetarians, and semi-vegetarians are there in the U.S.? How many vegetarian meals do they eat? And why do they choose to limit their consumption of meat and other animal products or avoid them entirely? If you’re interested in these questions, Faunalytics has the answers in this infographic.